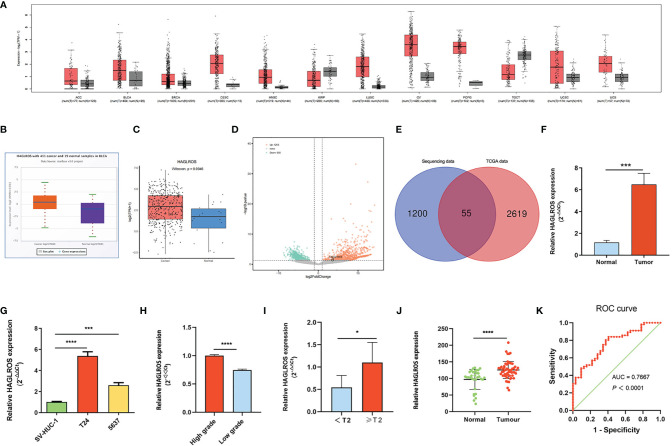
Figure 1.
HAGLROS expression is significantly upregulated in BC. (A) The expression of HAGLROS in common tumour samples and paired normal tissues was analyzed through the GEPIA database. (B, C) The HAGLROS expression level in BC was explored using the starBase database (P<0.0001) and the Lnc2Cancer database (P=0.0046). (D) Volcano plot of DE-lncRNAs in our transcriptome sequencing dataset. Each point in the plot represents a gene. Orange dots represent upregulated genes, whereas green dots represent downregulated genes. (E) Venn diagram of upregulated DE-lncRNAs based on the overlap between TCGA dataset and our RNA-sequencing dataset. (F, G) HAGLROS expression in BC samples and cells was determined using qRT–PCR assays. (H, I) HAGLROS expression was determined using qRT–PCR assays in different pathologic grades and clinical stages tissues. (J) ISH was performed to detect the expression of HAGLROS in bladder tissue microarray. (K) ROC curve for prediction of BC using ISH-based HAGLROS expression level. The AUC was 0.7667, P<0.0001. Each experiment was repeated at least three times. *P < 0.05, ***P < 0.001, ****P < 0.0001.

