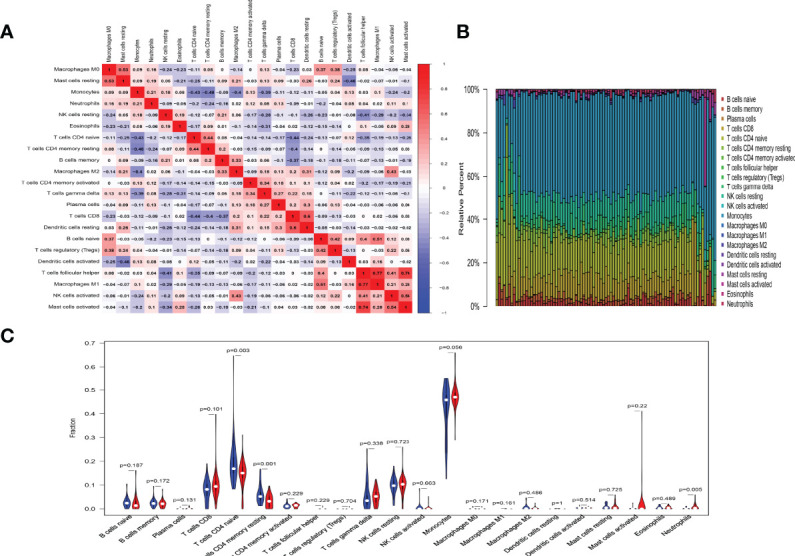
Figure 1.

Results of immune cells change. (A) Correlation matrix of the changes in number of 22 immune cells in SSc PBMCs. Red indicates a positive correlation; blue indicates a negative correlation. The larger the absolute value of the number, the more positive or negative correlation there is. (B) Landscape of immune cells changes. (C) A violin diagram of the immune cell proportions in two groups. The blue fusiform fractions on the left represent the SSc group, and the red fusiform fractions on the right represent the SSc-PAH group.
