Figure 2.

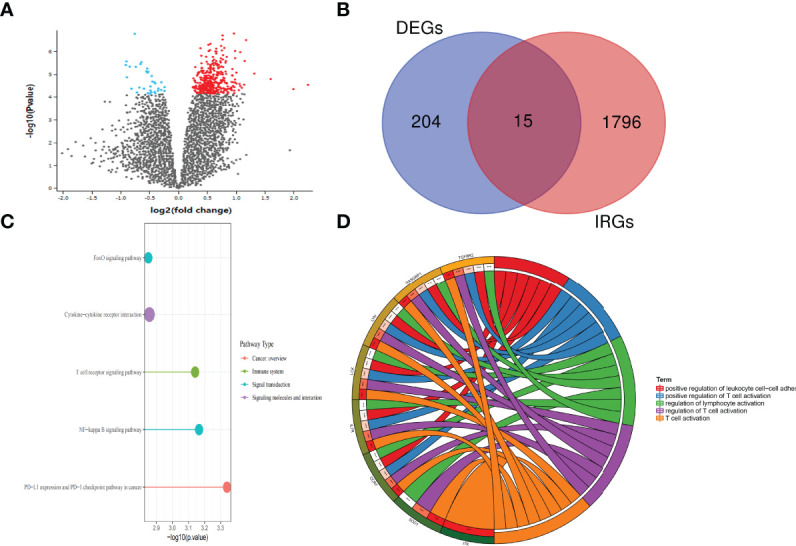
Differential expression of genes between the SSc and SSc-PAH groups. (A) Volcano plot of the differentially expressed genes between SSc and SSc-PAH. Black points represent the adjusted p-value >0.05. Blue points represent adjusted p-value <0.05 and downregulated genes. Red points represent adjusted p-value <0.05 and the upregulated genes. (B) The Venn diagram of differentially expressed IRG intersection between IRGs (1,901 IRGs downloaded from the Immport website) and DEGs (219 DEGs selected). (C) Enrich KEGG class plot reveals the top 5 IRGs. The top 5 most enriched KEGG pathways of those 15 IRGs were as follows: PD-L1 expression and PD-1 checkpoint pathway in cancer, NF-kappa B signaling pathway, T-cell receptor signaling pathway, and FoxO signaling pathway. (D) Chord plot shows the top 5 most enriched Gene Ontology (GO)-molecular function terms: T-cell activation, regulation of T-cell activation, regulation of T-cell activation, positive regulation of T-cell activation, and positive regulation of leukocyte cell–cell adhesion. ***p-value < 0.001.
