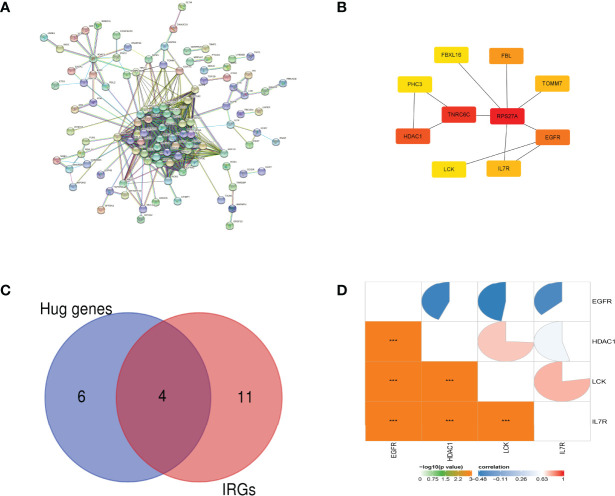
Figure 3.
PPI network analysis and hub gene identification. (A) The interaction network between proteins coded by DEGs. (B) Ten hub genes were screened by the network recognition ensemble algorithm. (C) The Venn diagram of differentially expressed IRG intersection between IRGs and hub genes. (D) The pie chart of the Pearson correlation analysis shows the correlation between 4 IRGs. *** p-value < 0.001.

