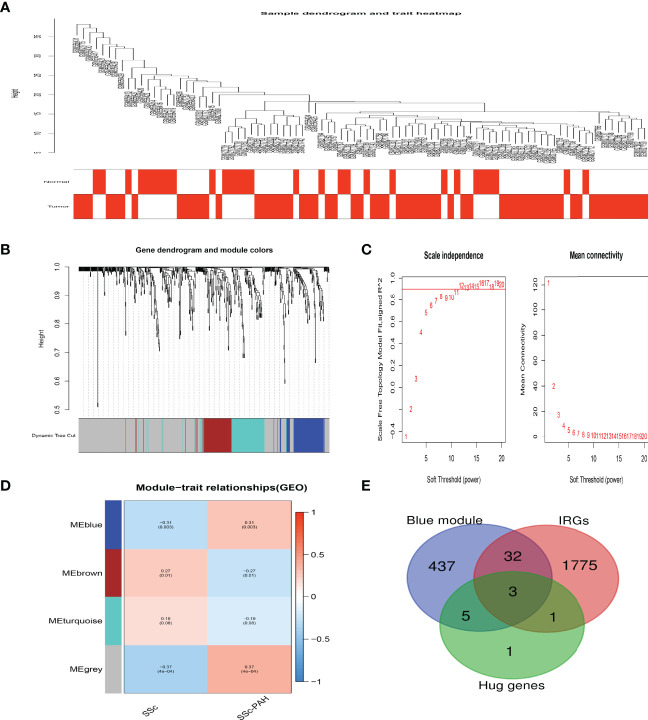
Figure 5.
Crucial modules in SSc-PAH. (A) Sample dendrogram and trait heat map. (B) Clustering dendrograms of genes based on a dissimilarity measure (1-TOM). (C) Analysis of the scale-free fit index (left) and the mean connectivity (right) for various soft-thresholding powers. (D) Module-trait associations were evaluated by correlations between module eigengenes and sample traits. (E) The Venn diagram indicating 3 genes from the blue module, ten hub genes, and IRGs.

