Figure 2.

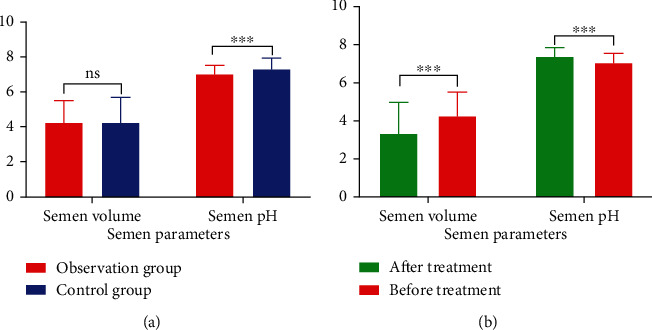
Comparison of semen parameters: (a) comparison between the treatment group and the observation group: SV: no difference, pH: P < 0.01. (b) Comparison of the observation group before and after treatment: SV and pH: all P < 0.01.

Comparison of semen parameters: (a) comparison between the treatment group and the observation group: SV: no difference, pH: P < 0.01. (b) Comparison of the observation group before and after treatment: SV and pH: all P < 0.01.