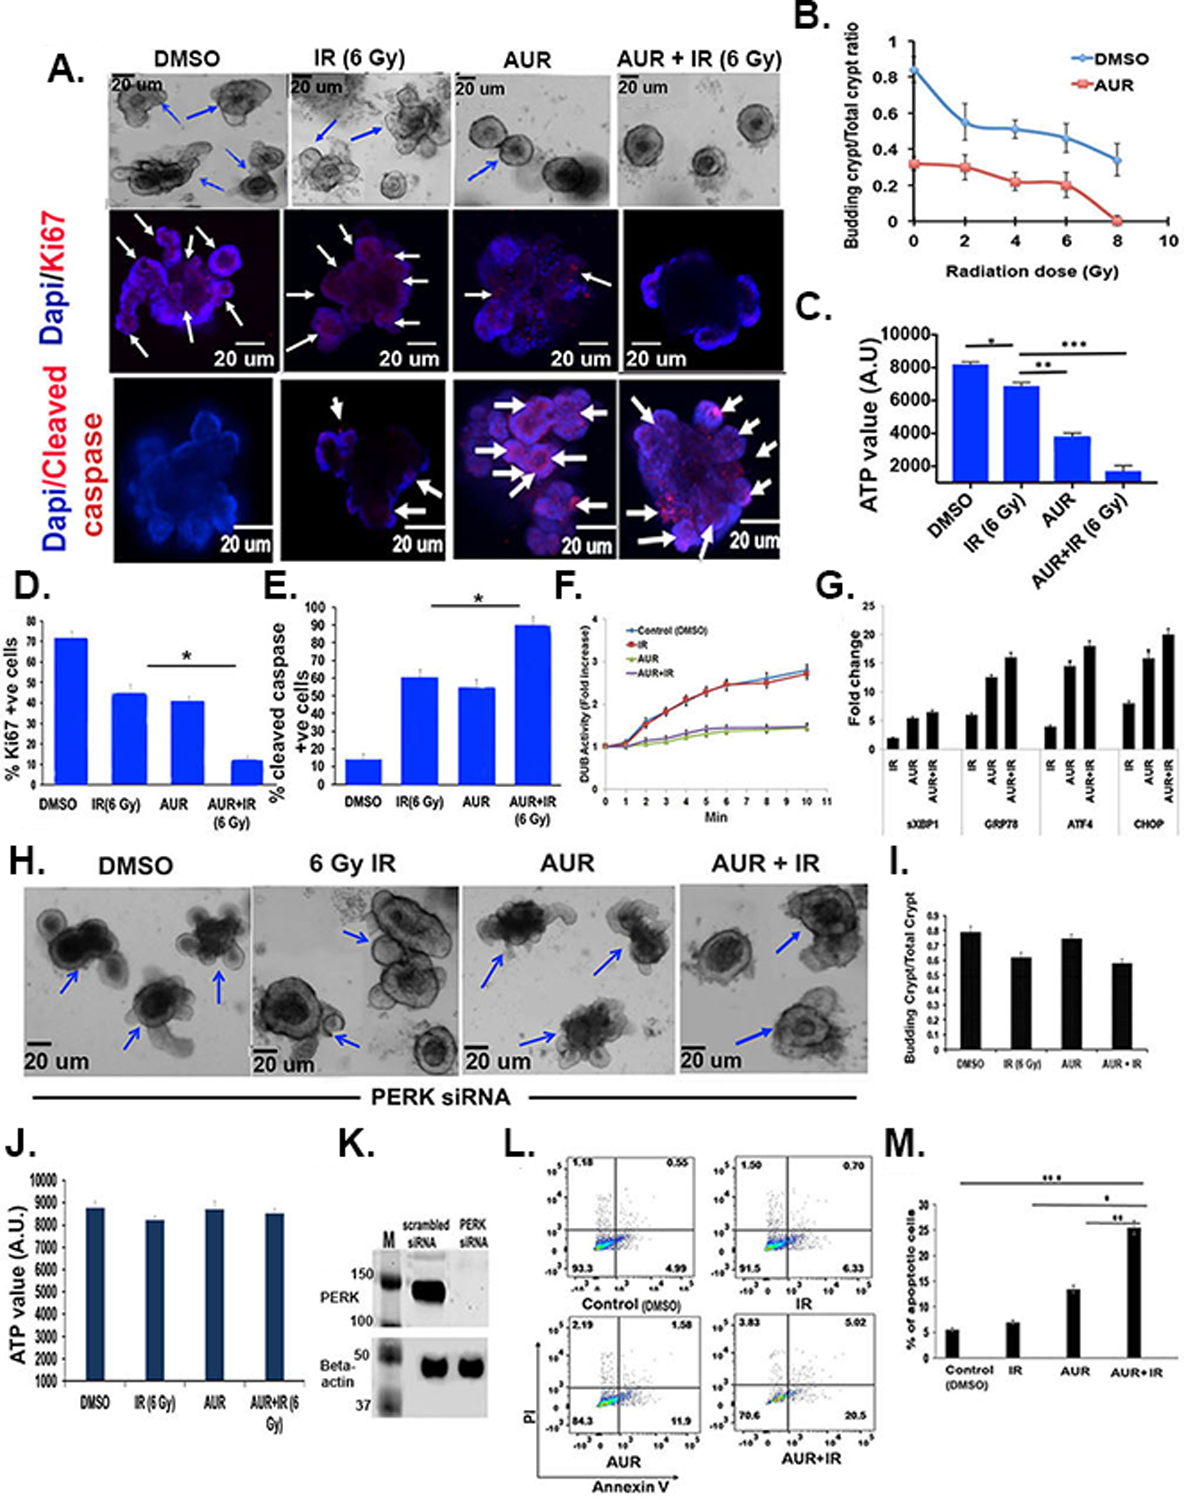
Figure 6:

Auranofin treatment sensitized organoids derived from human malignant colon to radiation therapy. A) Images of organoids derived from human malignant colon. Upper panel: Phase contrast microscopic images. Middle panel: Confocal microscopic images of organoids stained with Ki67 (red color, indicated with arrow). Nucleus stained with DAPI (blue color). Lower panel: Confocal microscopic image of organoids stained with cleaved caspase (red color, indicated with arrow). Nucleus stained with DAPI (blue color). B) Budding crypt/total crypt ratio as a function of radiation dose (n=6 specimens). Addition of auranofin resulted in significant reduction of the budding crypt ratio compared to radiation only: 2 Gy+AUR vs 2 Gy+DMSO p<0.0005; 4 Gy + AUR vs 4 Gy + DMSO p<0.0002; 6 Gy + AUR vs 6 Gy + DMSO p<0.0002 and 8 Gy + AUR vs 8 Gy + DMSO p<0.002. C) Histogram demonstrating auranofin pre-treatment significantly reduces ATP levels compared to radiation only (6 Gy vs 6 Gy + AUR ***p<0.0003) (n=3 specimens). D) Histogram demonstrating auranofin pre-treatment significantly reduced Ki67 positive cells compared to radiation only (6 Gy vs 6 Gy + AUR, *p<0.0002) (n=3 specimens). E) Histogram demonstrating auranofin pre-treatment significantly induced cleaved caspase positive apoptotic cells compared to radiation only (6 Gy + AUR vs 6 Gy, *p<0.0004) (n=3 specimens). F) DUB activity over time was assessed in organoid lysate using the Ub-AMC substrate. Significantly lower DUB activity was ovbserved in the AUR plus radiation treated organoid compared to radiation only or untreated control (p<0.008 and p<0.002, respectively). Treatment with auranofin without radiation also significantly reducedDUB activity compared to irradiated or untreated control (p<0.005 and p<0.002, respectively) (n=3 specimens). The experiment was repeated three times, yielding similar results. G) qPCR analysis demonstrated increased mRNA expression of sXBP1, GRP78, ATF4 and CHOP with radiation and radiation plus auranofin. H) Phase contrast images of organoids treated with PERK siRNA. I) Histogram demonstrating budding crypt/total ratio in organoids treated with PERK siRNA. J) Histogram demonstrating ATP level in organoids treated with PERK siRNA. K) Immunoblot demonstrating PERK expression in crypt organoid cells treated with siRNA for PERK or scrambled siRNA. L) Flow cytometry plot demonstrating Annexin V-FITC and PI positive apoptotic cells. M) Histogram demonstrating that AUR+IR treatment resulted in more Annexin V-FITC positive apoptotic cells than for controls (***,p<0.001), radiation only (**, p<0.002), or AUR only (*,p<0.005) (n=3 specimens).
