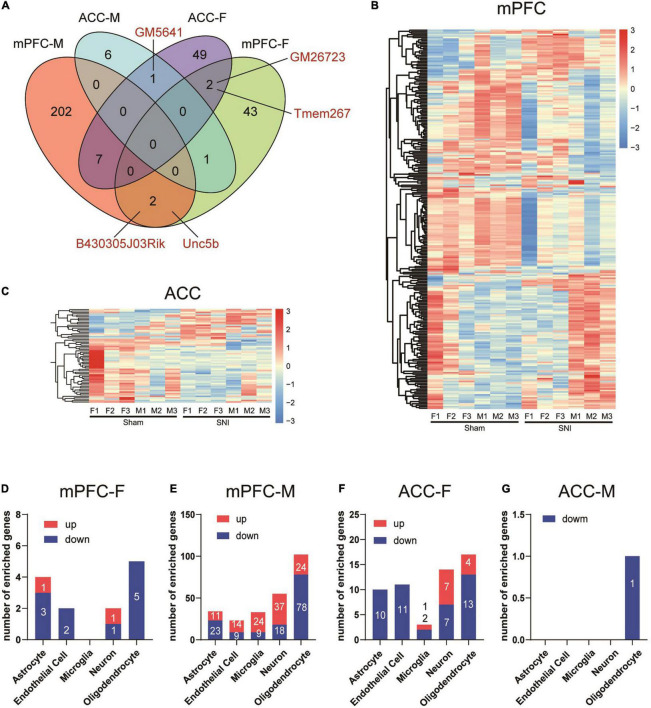
FIGURE 3.
Differential transcriptomic profiles and cell-type enrichment of the DEGs induced in the mPFC and the ACC of mice of different sexes by SNI. (A) Venn diagram depicting limited overlaps of the DEGs between the mPFC and the ACC, as well as between different sexes. mPFC-F, the mPFC of female mice; mPFC-M, the mPFC of male mice; ACC-F, the ACC of female mice; ACC-M, the ACC of male mice. Hierarchical clustered heatmaps of the mPFC (B) and the ACC (C), showing relative expression of the DEGs across the sham and the SNI groups in different sexes (F, female; M, male). Color scales represent standardized rlog-transformed values across samples. (D–G) The numbers of DEGs enriched in different cell types in the mPFC and the ACC of female and male mice, comparing the sham versus the SNI groups, as determined from a database of cell type-specific transcripts in the mouse cortex by Zhang et al. (2014).

