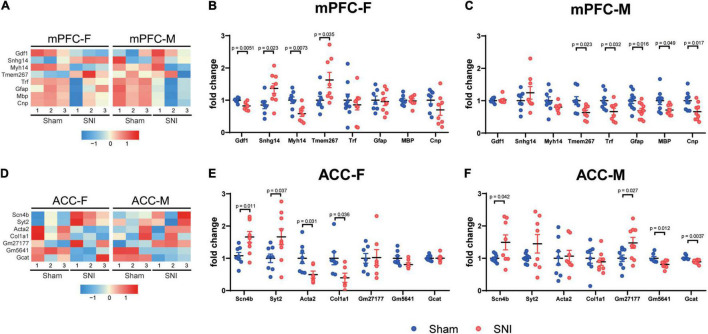
FIGURE 4.
Quantitative PCR validation of the DEGs between the sham and the SNI groups in the mPFC and the ACC of mice of different sexes. Heatmaps showing relative expression levels of the selected upregulated and downregulated DEGs in the mPFC (A) and the ACC (D) of female and male mice, comparing the sham versus SNI groups. mPFC-F, the mPFC of female mice; mPFC-M, the mPFC of male mice; ACC-F, the ACC of female mice; ACC-M, the ACC of male mice. Color scales represent standardized rlog-transformed values across samples. qPCR validation results of the selected upregulated and downregulated transcripts in the mPFC (B,C) and ACC (E,F). N = 6–9 mice per group. Data are analyzed by unpaired Student’s t-test, and presented as mean ± SEM.

