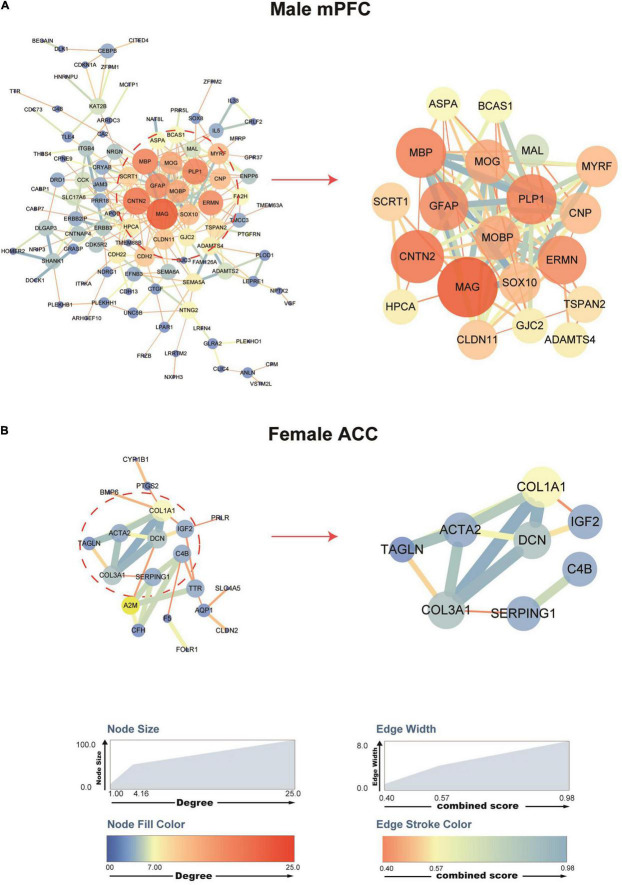
FIGURE 5.
Protein–protein interaction (PPI) networks of the DEGs in the male mPFC and female ACC, comparing the sham versus the SNI groups. STRING PPI networks depicting the potential interactions of the DEGs in the mPFC (A) and the ACC (B) at 2 weeks after SNI. The color and size of the nodes are relative to the degree of the connectivity, and the color and size of the edges are relative to the combined score of the interactions.

