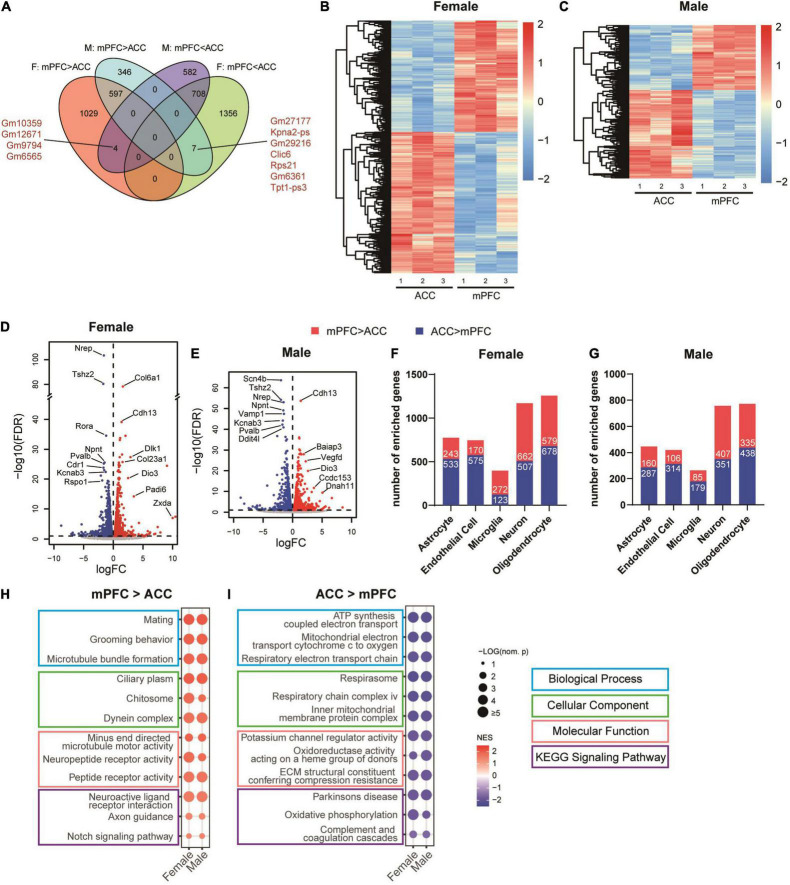
FIGURE 7.
Differences between the transcriptomic profiles of the mPFC versus the ACC of female and male mice in the sham group. (A) Venn diagram depicting partial overlaps of the DEGs comparing the mPFC versus the ACC between the female and male mice. F, female; M, male. mPFC > ACC: transcripts expressed significantly more in the mPFC than in the ACC; mPFC < ACC: transcripts expressed significantly more in the ACC than in the mPFC. Hierarchical clustered heatmaps showing relative expression of the DEGs comparing the ACC versus the mPFC in the female (B) and male (C) mice from the sham group. Color scales represent standardized rlog-transformed values across samples. The volcano plots of the DEGs in the female (D) and male (E) mice, with horizontal lines at the –log10 (false discovery rate, FDR) = 1 and vertical lines at log2 (fold change, FC) = 0. Blue dots represent transcripts expressed significantly more in the ACC than the mPFC, and the red dots represent transcripts expressed significantly more in the mPFC than the ACC. The numbers of DEGs enriched in different cell types in the female (F) and male (G) mice, comparing the mPFC versus the ACC. Top differentially enriched gene sets in the mPFC (H) versus the ACC (I). The size of the dots indicates the –log10 (nominal p) values, and the color indicates the normalized enrichment scores (NES).

