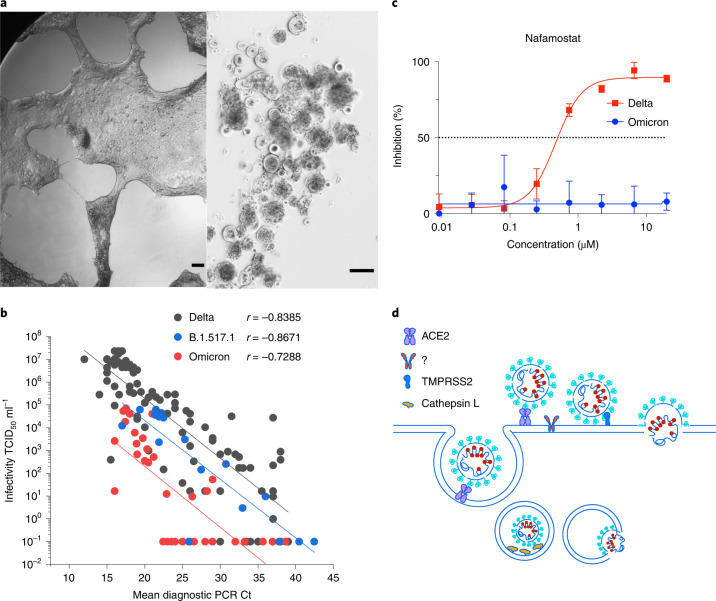
Fig. 5. Rapid isolation and characterization of the SARS-CoV-2 Omicron variant.
a, Primary Omicron sample (Ct 22) was filter-sterilized using 0.22 μm centrifugal filters and then co-cultured with the HAT-24 line. Left: 48 h of culture. Right: 72 h of culture. As with other SARS-CoV-2 variants, extensive syncytia accumulated within the HAT-24 line. Scale bars, 200 μm. b, End-point titres of Omicron plotted against the diagnostic PCR Ct value as described in Fig. 4. Spearman coefficient of correlation between end-point titres and Ct values for Omicron, r = −0.7288 (P < 0.001, two-tailed). Delta and the early variant B.1.517.1 linear regressions are overlaid for comparison. Data are from the 96 h timepoint. c, Titration of the TMPRSS2 inhibitor Nafamostat using the HAT-24 cell line. Note: the lack of inhibition in Omicron versus Delta at all concentrations tested reveals limited usage of TMPRSS2 by Omicron. Shown are the mean ± s.d. of technical replicates done in quadruplicate. Each panel is representative of a minimum of three independent experiments. d, Potential alternative pathways of viral entry in Omicron versus other SARS-CoV-2 variants. All SARS-CoV-2 variants can enter via endocytosis (left pathway) or at the plasma membrane by TMPRSS2 cleavage. The change in tropism of Omicron either reflects viral fusion primarily at the endosome using Cathepsin L or fusion at the membrane using an alternate protease to TMPRSS2 (designated herein as ?).

