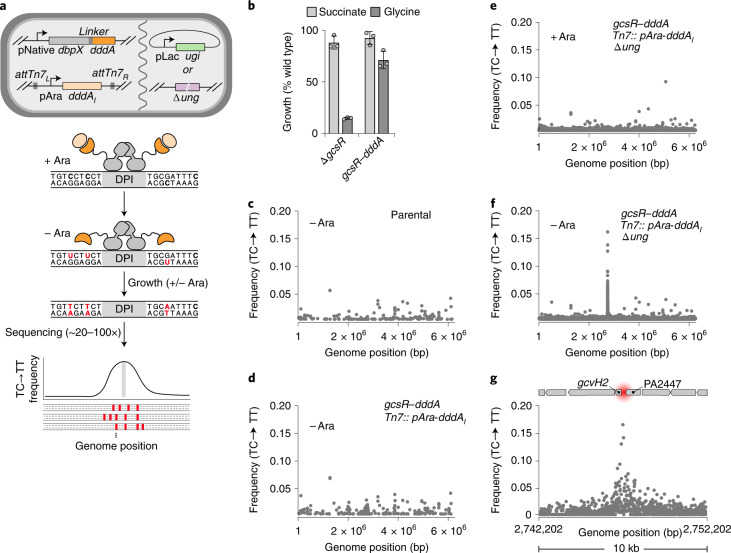
Fig. 1. 3D-seq for in vivo DNA–protein interaction mapping in P. aeruginosa.
a, Diagram providing an overview of the 3D-seq method. Top: cell schematic containing the genetic elements required for 3D-seq. Elements may be integrated into the chromosome or supplied on plasmids. Middle: model depicting localized activity of DddA (dark orange) when fused to a DBP of interest (grey) and after growth in the absence of arabinose to limit production of DddAI (light orange). Bottom: schematized 3D-seq output indicating enrichment of C•G-to-T•A transitions (red) in the vicinity of a DPI site (grey). b, Growth yield (normalized to WT) of the indicated strains on minimal medium containing glycine or succinate as the sole carbon source. Mean ± s.d. are shown; n = 3 biologically independent cultures, and results are representative of two experiments conducted. c–f, Average (n = 4) C•G-to-T•A transition frequency by genome position after passaging cultures of P. aeruginosa bearing the indicated genotypes, in the presence or absence of arabinose (Ara) to induce DddAI expression. Data were filtered to remove a prophage hypervariable region and positions with low sequence coverage (<15-fold read depth). g, Zoomed view of a subset of the data depicted in f. Approximate location of the previously characterized GcsR binding sites (red) and adjacent genetic elements are shown to scale at the top.

