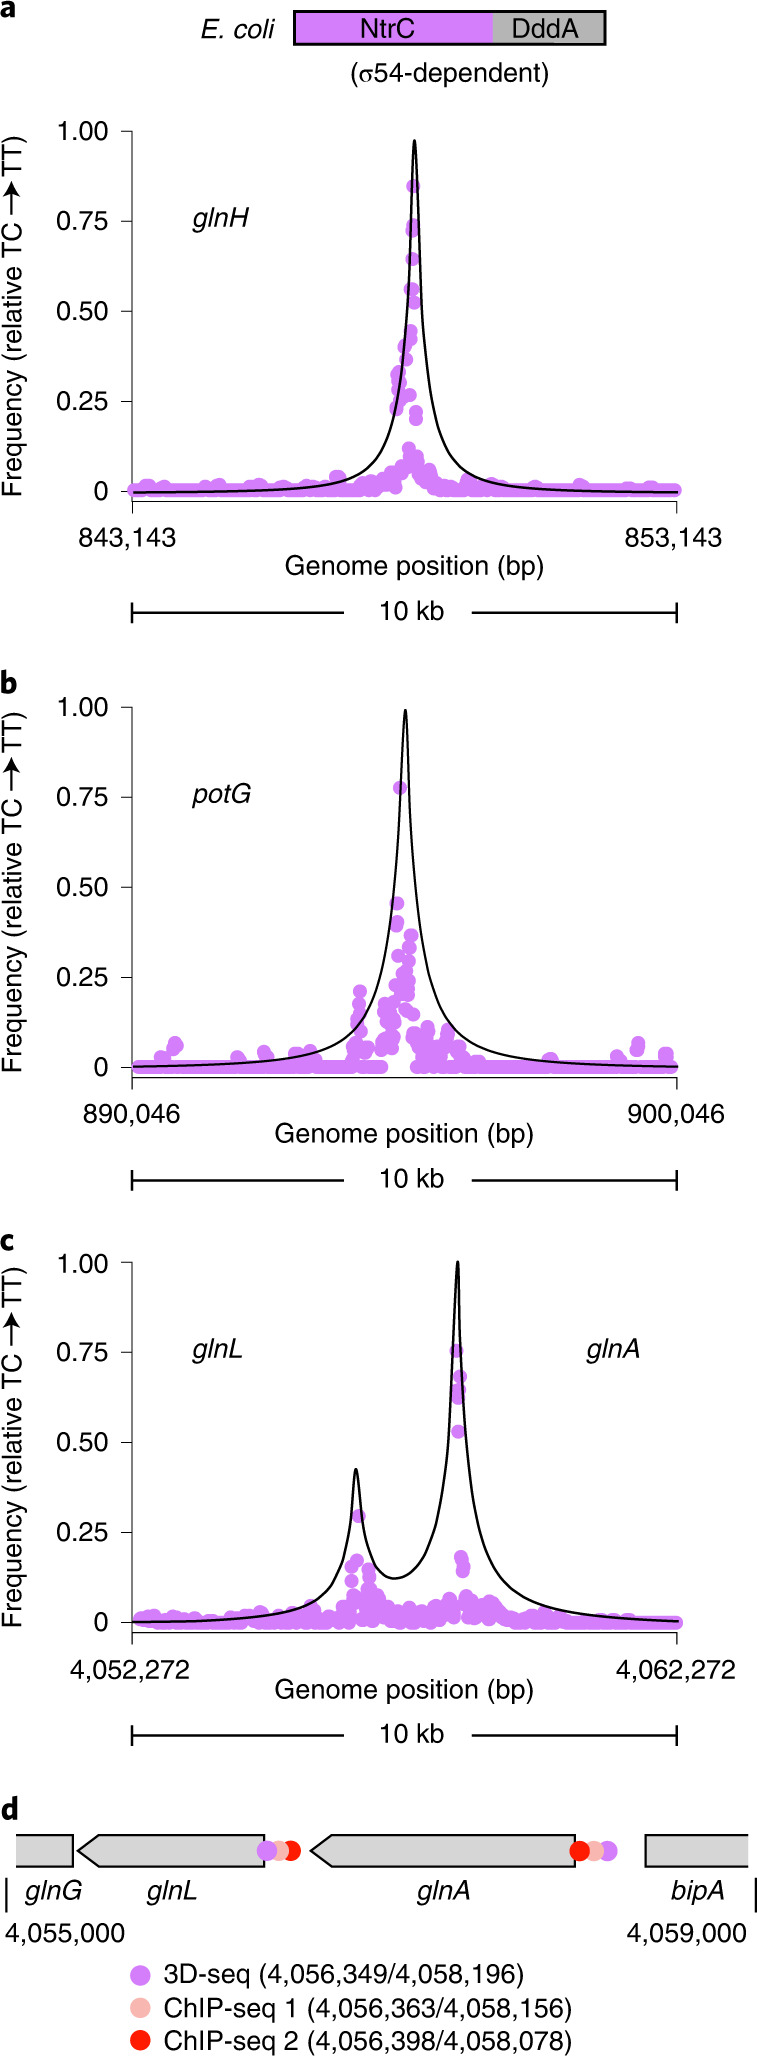
Fig. 5. 3D-seq maps binding sites of NtrC in E. coli with single-gene resolution.

a–c, Moving average (n = 4, 75 bp window) of C•G-to-T•A transition frequencies at genomic locations encompassing previously predicted NtrC binding sites upstream of the indicated genes. Points were calculated from filtered 3D-seq data derived from E. coli expressing NtrC–DddA grown for multiple passages in minimal media with limiting nitrogen (2 mM NH4Cl) in the absence of IPTG for induction of DddAI–F. d, Schematic depicting the location of NtrC binding sites predicted by 3D-seq and two previous ChIP-seq studies in the vicinity of two adjacent NtrC-regulated genes, glnA and glnH (ChIP-seq 1, ref. 34; ChIP-seq 2, ref. 37).
