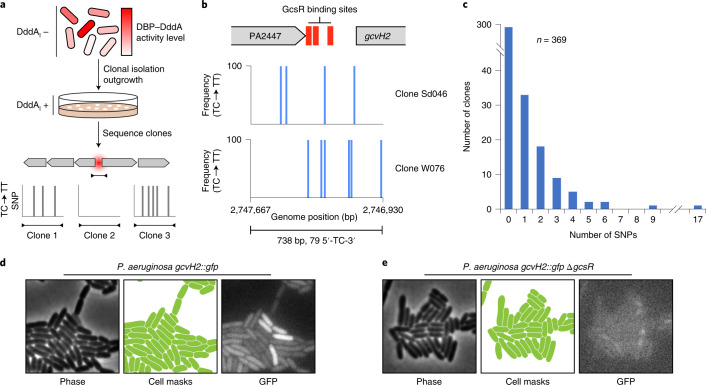
Fig. 6. Single cell DNA–protein interaction measurements using 3D-seq.
a, Schematic depicting the generalized workflow of a single-cell 3D-seq experiment. In the initial population, there are varying levels of activity of the DBP–DddA fusion (top), which are measured as the total number of SNPs at a target site (red sphere) following sequencing of individual clones (bottom). b, Single-cell 3D-seq data for P. aeruginosa GcsR. Locations of SNPs (blue bars) within the gcvH2 promoter region are shown for the two indicated clones. Adjacent SNPs are not differentiated with separate bars. Clone labels correspond to those in Supplementary Table 3. c, Summary of SNPs detected within the sequencing window indicated in b among 369 P. aeruginosa GcsR single-cell 3D-seq clones. d,e, Cropped micrographs and corresponding computed cell mask regions for the indicated P. aeruginosa strains expressing green fluorescent protein (GFP) under the control of the gcvH2 promoter. Scale bar, 1 μm. Images are representative of those collected in two independent experiments.

