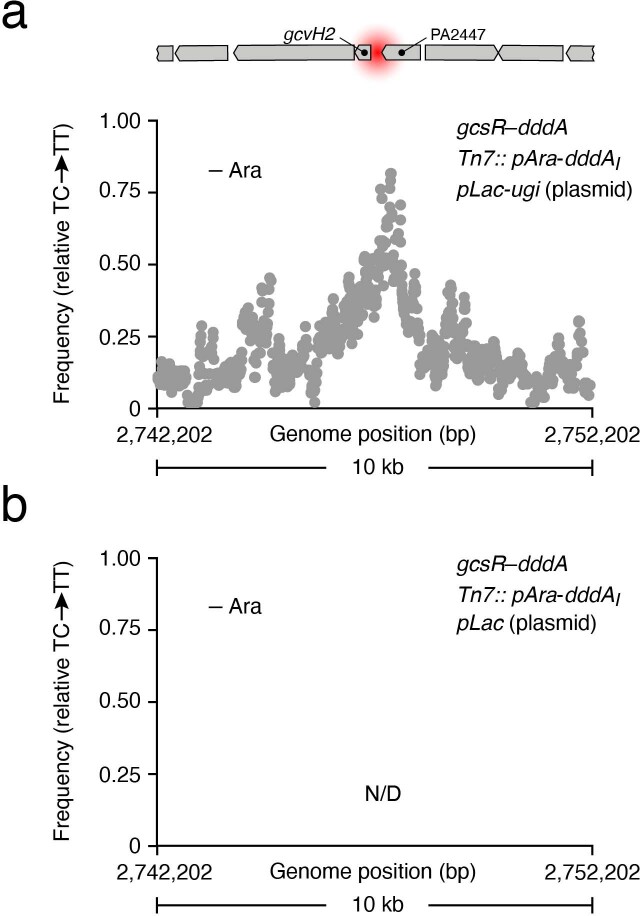
Extended Data Fig. 2. Ugi expression can substitute for genetic inactivation of ung in 3D-seq.
a, b, Moving average (n = 4, 75 bp window) of C•G-to-T•A transition frequencies calculated from filtered 3D-seq data deriving from the indicated P. aeruginosa strains grown in the absence of arabinose for 20 hrs. IPTG was included to induce the expression of Ugi throughout the growth period. The location of the previously characterized GcsR binding site (red) and adjacent genetic elements are shown to scale above.

