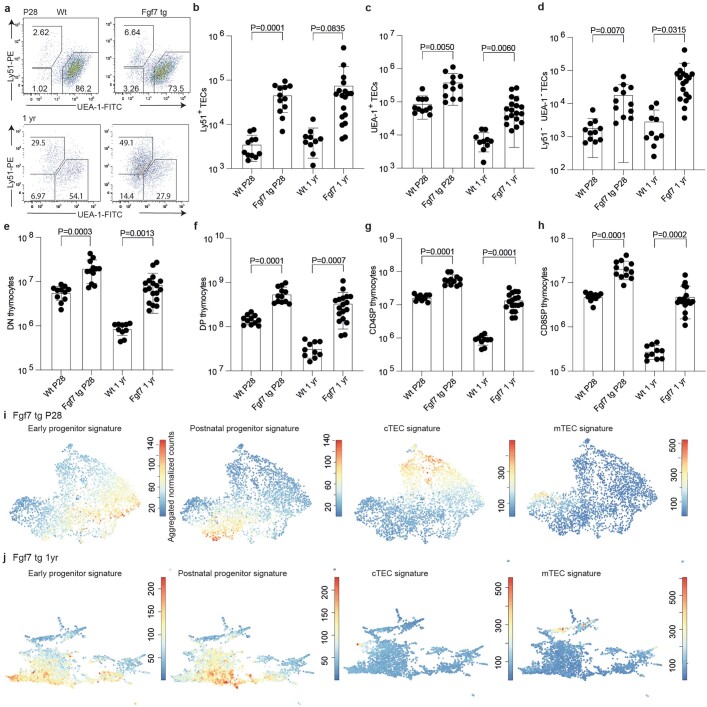
Extended Data Fig. 12. Changes in the thymic microenvironment upon autocrine Fgf stimulation.
a, Representative flow cytometric profiles of Epcam+CD45– TECs from wild-type (left panel) and Foxn1:Fgf7 transgenic (right panel) mice at either 4-weeks (P28) or 1-year (1 yr) of age (top and bottom rows respectively); the percentages of individual TEC subpopulations are indicated in the respective gates. b–d, Numerical analysis of TEC subpopulations based on flow cytometry. For b-d, Wt P28, n = 11; Fgf7 tg P28, n = 12; Wt 1 yr, n = 10; Fgf7 tg 1 yr, n = 18. Data are shown as mean±s.e.m. e–h, Flow cytometric analyses of CD45+ thymocyte populations; DN, CD4–CD8–; DP, CD4+CD8+; CD4SP, CD4+CD8–; CD8SP, CD4–CD8+. For e-h, Wt P28, n = 11; Fgf7 tg P28, n = 12; Wt 1 yr, n = 10; Fgf7 tg 1 yr, n = 18. Data are shown as mean±s.e.m. t-test; two-sided; P values are indicated. i, j, UMAP representation of progenitor and mature TEC populations in Foxn1:Fgf7 transgenic mice at (i) P28 and (j) 1 year of age.

