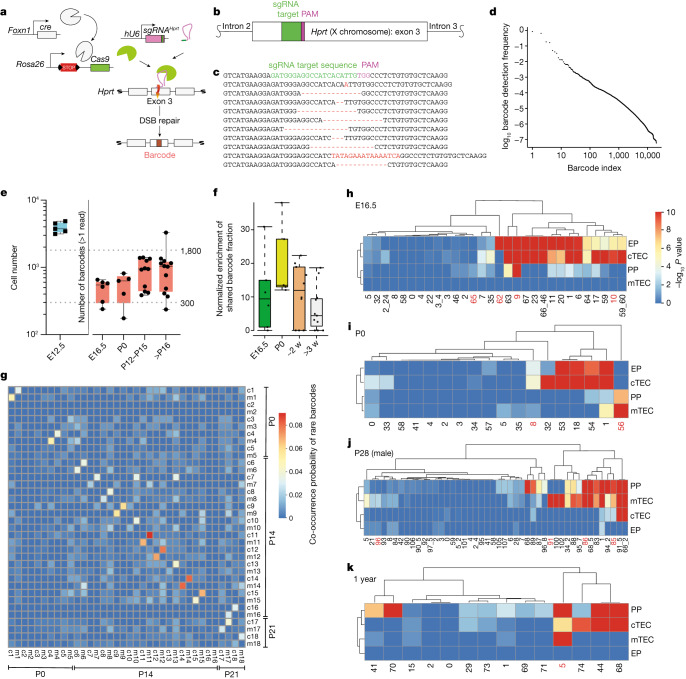
Fig. 2. Barcoding shows the differentiation capacity of progenitor populations.
a, Schematic of the CRISPR–Cas9-based barcoding system. DSB, double-strand break. b, Location of the target site in exon 3 of the mouse Hprt gene. c, Examples of barcodes; the germline sequence is shown with the sgRNA target and protospacer adjacent motif (PAM) sequences indicated at top. Nucleotide additions and deletions (dashes) are indicated in red. d, Frequencies of individual barcodes in decreasing order. e, Number of Foxn1-expressing TECs in the thymic rudiment of E12.5 embryos9 (left; n = 5) and numbers of different barcodes in the thymi of mice of different ages (right): E16.5, n = 6; P0, n = 5; P12–P15, n = 11; >P16, n = 12. The dotted lines indicate the range of the numbers of progenitors previously inferred from medullary islet counts in adult mice26. f, Enrichment of shared barcodes in the Ly51–UEA-1+ mTEC and Ly51+UEA-1– cTEC fractions of mice of different ages. Enrichment values were significantly different in the comparison of mice at P0 and >3 weeks (w) (P = 0.009, one-sided Wilcoxon test). E16.5, n = 6; P0, n = 5; ~2 weeks, n = 11; >3 weeks, n = 11. For e and f, boxes extend from the 25th to 75th percentile; whiskers extend to the largest and smallest values; and the median is indicated. See the Methods for a definition of the enrichment value Em. g, Co-occurrence probability of rare barcodes across pairs of samples highlighting enhanced co-occurrence in mTEC (m) and cTEC (c) fractions of the same mouse; individual mice are identified by number. Data are shown for n = 18 mice. h–k, P values (–log10) of barcode frequencies indicating co-occurrence of individual barcodes in progenitor and mature TEC fractions (as defined in Fig. 1c–f) at different time points. For g–k, P values were calculated as described in the Methods and corrected for multiple testing by the Benjamini–Hochberg method. The red numbers refer to clones discussed in the text.

