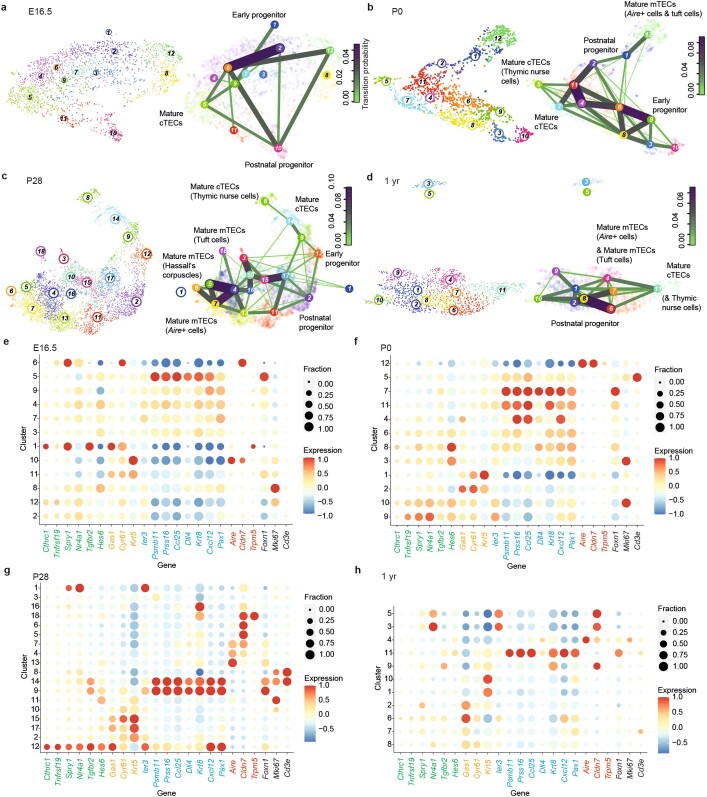
Extended Data Fig. 3. Age-dependent changes in the TEC compartment.
a–d, UMAP representation of transcriptome similarities between individual TECs isolated from thymi at various time points. Note that for P28, a combined analysis of three mice (2 females, 1 male) is shown, as they were subsequently used for the barcoding analysis; in Fig. 1, data from an additional non-barcoded mouse is included. Left panels in a-d indicate the cluster designation deduced by VarID. The right panels indicate the transcriptional relationships in terms of VarID-derived transition probabilities; connections with probabilities P > 0.001 are shown and the transition probabilities are indicated by line thickness and colouring. For orientation purposes, the major cell populations are also indicated. Cells derived from ectopic parathyroid tissue were detected at P28 (c, cluster 8), and 1 year (d, clusters 3 and 5). e–h, Expression profiles of TEC clusters for the indicated signature genes and the four time points. The fractions of each cluster expressing a particular gene and their respective expression levels are depicted according to the scales shown on the right. Dot colour represents the z-score of the mean expression levels of the gene in the respective cluster, and dot size represents the fraction of cells in the cluster expressing the gene; gene names are coloured according to shared expression patterns (EP: green; PP: orange; cTEC, blue; mTEC, red; other genes of interest, black). z-scores above 1 and below −2 are replaced by 1 and -1 respectively.

