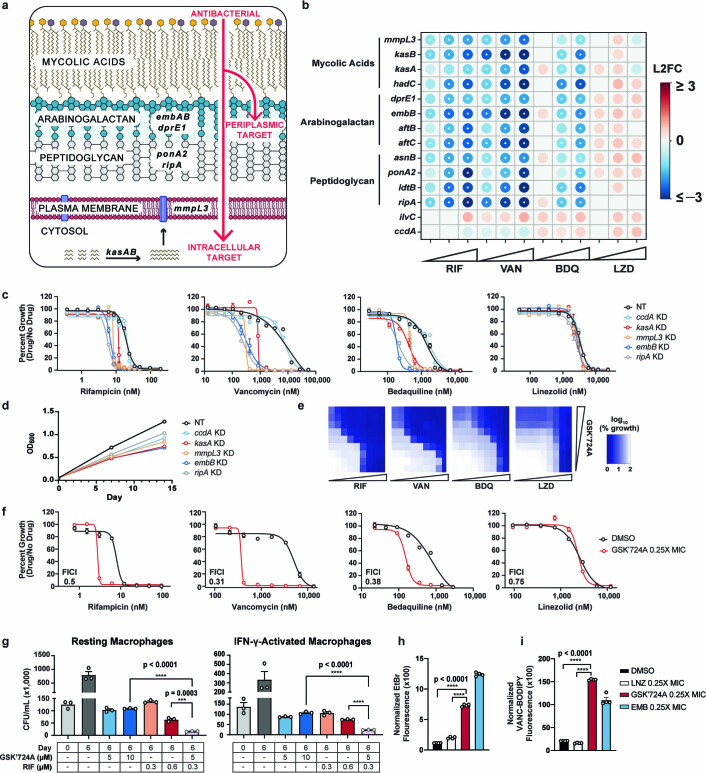
Extended Data Fig. 4. The Mtb envelope mediates intrinsic resistance to a subset of drugs.
a, Diagram of the mycobacterial mAGP complex. Select genes involved in mycolic acid synthesis and transport (kasAB, mmpL3), arabinogalactan biosynthesis (embAB, dprE1), and peptidoglycan remodeling (ponA2, ripA) are highlighted. b, Heatmap of chemical-genetic hit genes from the 5-day CRISPRi library pre-depletion screen. The color of each circle represents the gene-level L2FC. A white dot represents an FDR < 0.01 and a | L2FC | > 1. ilvC and ccdA are included as non-hit controls. c,d, Single strain validation of mAGP-associated hits. Dose-response curves (c, mean ± SEM, n = 3 biological replicates) for the indicated hypomorphic CRISPRi strains. Growth curves (d, mean ± SEM, n = 3 biological replicates) are derived from the vehicle control samples. NT = non-targeting; KD = knockdown. e,f, KasA inhibitor (GSK’724 A) checkerboard assays to quantify drug-drug interactions. Dose-response curves (f, mean ± SEM, n = 3 biological replicates) are shown for each drug in the absence (DMSO) or presence of 0.25X MIC80 GSK’724 A. The fractional inhibitory concentration index (FICI) values listed represent the lowest value obtained from each checkerboard assay. g, GSK’724 A synergy with rifampicin in resting and IFN-γ-activated murine bone marrow derived macrophages (mean CFU/ml ± SEM, n = 3 biological replicates). Results from an unpaired, two-tailed t-test are shown. h,i, Ethidium bromide (h) and Vancomycin-BODIPY (i) uptake (mean ± SEM, n = 4 biological replicates) of H37Rv pre-treated for two days with DMSO or subinhibitory linezolid, GSK’724 A, or ethambutol. Results from an unpaired, two-tailed t-test are shown.

