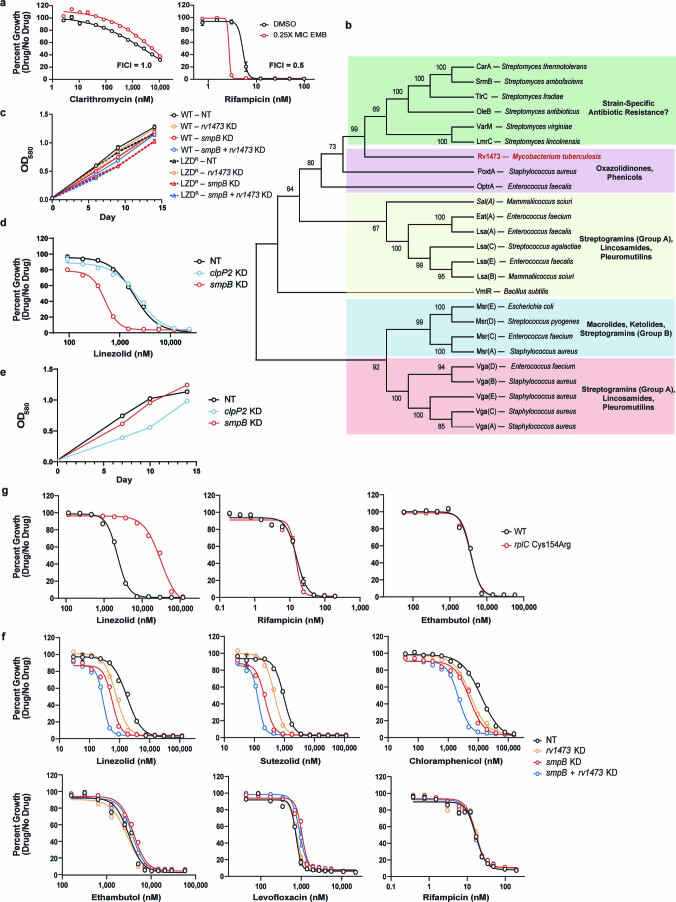
Extended Data Fig. 6. Mtb encodes diverse mechanisms of intrinsic resistance to ribosome-targeting antibiotics.
a, Ethambutol checkerboard assays to quantify drug-drug interactions. Dose-response curves (mean ± SEM, n = 3 biological replicates) are shown for each drug in the absence (DMSO) or presence of 0.25X MIC80 of EMB. Fractional inhibitory concentration index (FICI) values listed represent the lowest value obtained from each checkerboard assay. b, Phylogenetic tree of antibiotic resistance (ARE) ABC-F proteins from the indicated species. Figure adapted from44 Bootstrap values (500 replicates) are indicated at each node. c, Growth curves for the linezolid-associated hit genes and control strains shown in Fig. 3d. Curves (mean ± SEM, n = 3 biological replicates) are derived from the vehicle control samples of the MIC assay. NT = non-targeting; KD = knockdown. d, Dose-response curves (mean ± SEM, n = 3 biological replicates) were measured for CRISPRi knockdown strains targeting smpB and clpP2 in wild-type H37Rv. e, Growth curves for the strains shown in panel (d). Curves (mean ± SEM, n = 3 biological replicates) are derived from the vehicle control samples of the MIC assay. f, Dose-response curves (mean ± SEM, n = 6 biological replicates) of WT H37Rv and an isogenic rplC-Cys154Arg mutant. g, Dose-response curves (mean ± SEM, n = 3 biological replicates) for the indicated CRISPRi strains.

