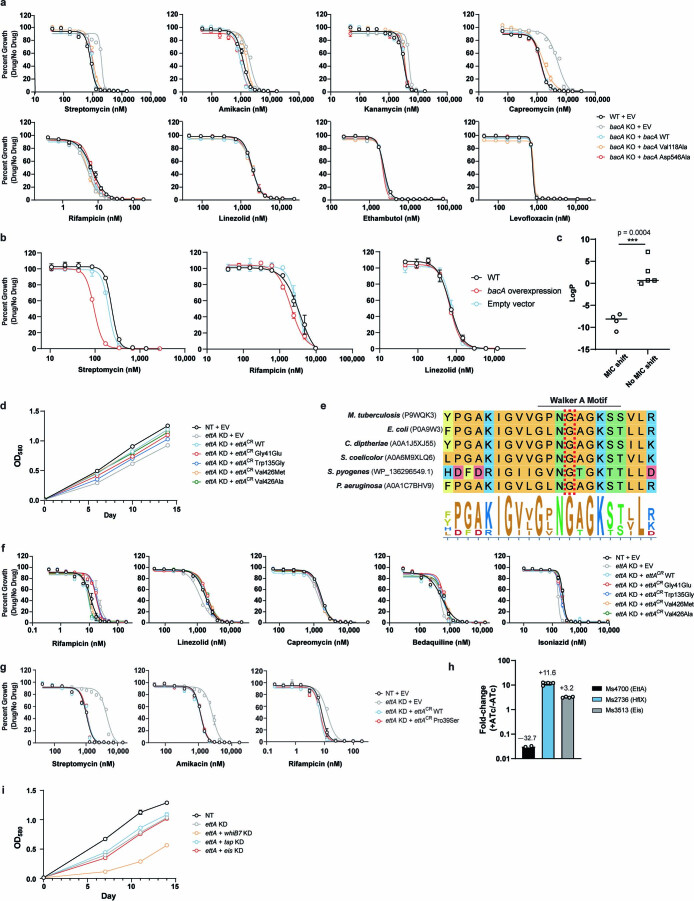
Extended Data Fig. 7. Loss-of-function mutations in bacA and ettA confer acquired drug resistance.
a, Dose-response curves (mean ± SEM, n = 3 biological replicates) show that the Val118Ala and Asp546Ala mutations in bacA do not confer drug resistance. KO = knockout; EV = empty complementation vector. b, Overexpression of Mtb bacA confers streptomycin sensitivity in M. smegmatis. Dose-response curves (mean ± SEM, n = 3 biological replicates) for the indicated strains. c, LogP values for the antibiotics to which bacA mutants show an increased MIC (streptomycin, amikacin, capreomycin, kanamycin) or no MIC change (rifampicin, ethambutol, levofloxacin, linezolid). Results from an unpaired t-test are shown: ***, p < 0.001. d, Growth curves for the strains shown in Fig. 5c. Curves (mean ± SEM, n = 3 biological replicates) are derived from the vehicle control samples of the MIC assay. KD = knockdown. e, Sequence alignment for EttA orthologs from the indicated species for the region surrounding the N-terminal Walker A motif. The Mtb EttA Gly41 residue is boxed. Accession numbers are listed next to each species. f, Dose-response curves (mean ± SEM, n = 3 biological replicates) for the strains shown in Fig. 5c.g, Dose-response curves (mean ± SEM, n = 3 biological replicates) show that the Pro39Ser mutation in ettA does not confer drug resistance. h, Quantitative mass spectrometry results following CRISPRi knockdown of ms4700 (described in15). Data represent protein level fold-change (mean ± SEM, n = 4 technical replicates derived from 2 biological replicates). Ms4700 could only be detected in two +ATc replicates and thus the mean ± SEM for duplicates is shown. i, Growth curves for the strains shown in Fig. 5e. Curves (mean ± SEM, n = 3 biological replicates) are derived from the vehicle control samples of the MIC assay.

