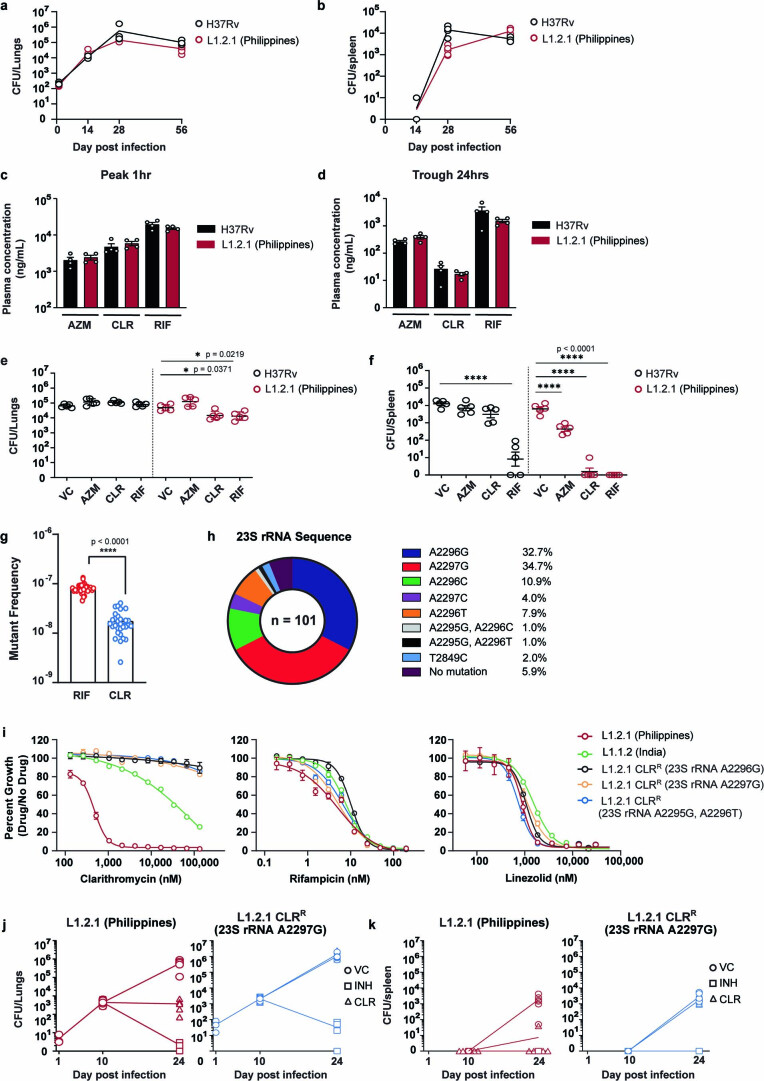
Extended Data Fig. 9. L1.2.1 is susceptible to clarithromycin in vivo.
a,b, Growth of H37Rv and L1.2.1 in vivo. BALB/c mice were infected with approximately 100-200 c.f.u. by aerosol. Mtb burden (mean c.f.u. ± SEM) in lungs (a) and spleens (b) was determined at the indicated timepoints. Data represent 3 mice at D0 (lung only), 5 mice at D14 and D28, and 6 mice at D56. c,d, Plasma drug concentrations (mean ± SD for 4 mice) after 2 weeks of drug therapy. Blood was collected at 1 h (c) and 24 h (d) post-dose after 13 daily doses from vehicle control (VC) and treatment groups further described in (e,f). Drug concentrations were measured in plasma using high pressure liquid chromatography coupled to tandem mass spectrometry. AZM = azithromycin; CLR = clarithromycin; RIF = rifampicin. e,f, Lung (e) and spleen (f) Mtb burden (mean c.f.u. ± SEM, n = 5 mice) in BALB/c mice after azithromycin (200 mg/kg), clarithromycin (200 mg/kg), or rifampicin (25 mg/kg) treatment. Mice were infected with approximately 100-200 c.f.u. of aerosolized Mtb. After two weeks to allow the acute infection to establish, chemotherapy was initiated. Following two weeks of drug therapy, Mtb bacterial load was determined. Statistical significance was assessed by one-way ANOVA followed by Tukey’s post-hoc test. *, p < 0.05; ****, p < 0.0001. g, Rifampicin and clarithromycin mutation frequency analysis with the L1.2.1 strain. Results from an unpaired, two-tailed student’s t-test are shown h, Distribution of 23 S rRNA mutations from in vitro-selected, clarithromycin-resistant L1.2.1 isolates from (g). i, Dose-response curves (mean ± SEM, n = 3 biological replicates) of representative CLR-resistant (CLRR) L1.2.1 isolates. j,k, Lung (j) and spleen (k) Mtb burden (mean c.f.u. ± SEM) in BALB/c mice after isoniazid (INH; 25 mg/kg) or clarithromycin (200 mg/kg) treatment. Mice were infected with approximately 100-200 c.f.u. of aerosolized Mtb. After ten days to allow the acute infection to establish, chemotherapy was initiated. Mtb bacterial load was determined at the indicated time points. Data represent 3 mice at D0 (lung only) and 6 mice at D10 and D24.

