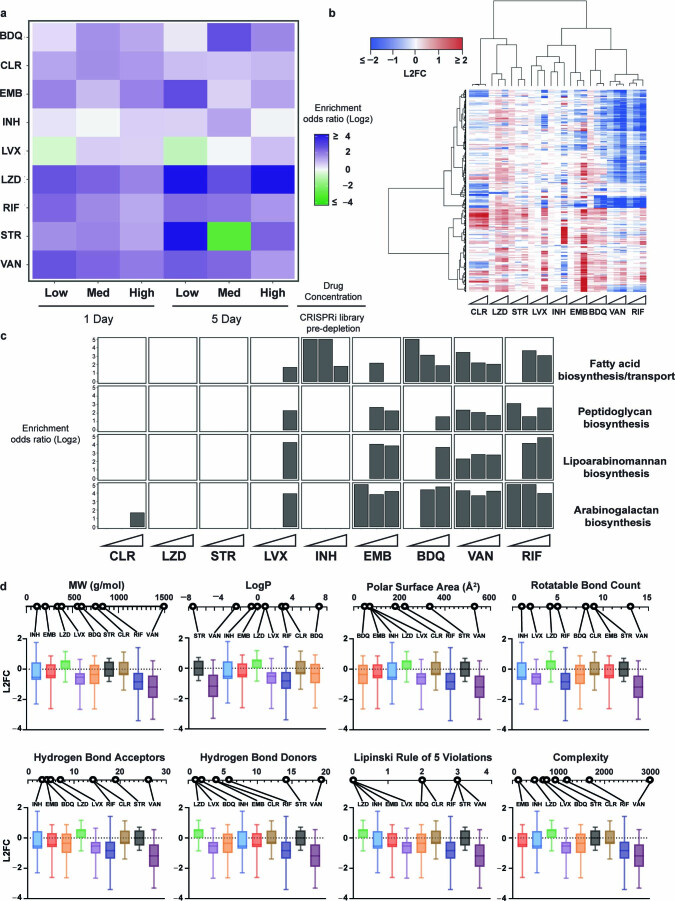
Extended Data Fig. 3. Clustering & enrichment analysis of chemical-genetic profiles.
a, Heatmap of odds-ratios showing enrichment of essential gene targeting sgRNAs as hits in the chemical-genetic screen. A Fisher’s exact test was used to evaluate enrichment of essential gene targeting sgRNAs relative to non-essential gene targeting sgRNAs amongst hit genes (FDR < 0.01, |L2FC | > 1) in the chemical genetic screen. BDQ = bedaquiline; CLR = clarithromycin; EMB = ethambutol; INH = isoniazid; LVX = levofloxacin; LZD = linezolid; RIF = rifampicin, STR = streptomycin; VAN = vancomycin. b, Heatmap showing clustered chemical-genetic profiles from the 5-day CRISPRi library pre-depletion screen. Genes are clustered along the vertical axis; for simplicity, only genes that hit in at least two drug conditions are shown (n = 676 genes). Ascending drug concentrations (“Low”, “Med”, “High” indicated by white triangles) are clustered along the horizontal axis. The median L2FC for each gene following drug selection (relative to vehicle control) is indicated on the color scale. If a gene was not a significant hit (FDR > 0.01), the L2FC value was plotted as 0 for the corresponding condition. c, Bar plots of the enriched (P < 0.05) KEGG categories for hit genes for the indicated drugs. KEGG annotations were manually updated to include the mycolic acid-arabinogalactan-peptidoglycan (mAGP) complex-associated genes described in20,21. d, Correlation of mAGP signature and drug physiochemical properties. For each drug, the L2FC distribution (“High” concentration, 5-day CRISPRi library pre-depletion) is shown for a select group of 78 genes involved in mAGP assembly and regulation as described in20,21. L2FC values (mean ± SEM, n = 3 biological replicates) for the 78 genes under each drug treatment are shown. For each condition, the box indicates the lower quartile, median, and upper quartile and whiskers represent the minimum and maximum L2FC values.

