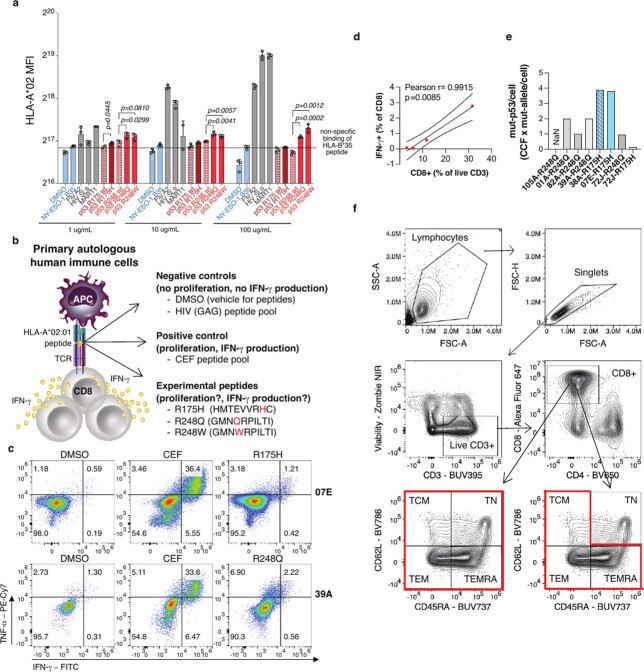
Extended Data Fig. 7. Differential T-cell reactivity to p53 neopeptides.
a, Flow cytometry quantification of HLA-A*02:01 expression on the surface of live T2 cells as a measure of peptide:MHC stabilization via binding to specific peptides. T2 cells were incubated overnight in serum-free media with recombinant human B2M and the indicated peptides at the indicated concentrations, or DMSO as vehicle control. Blue, negative controls (DMSO and unrelated HLA-B*35-restricted NY-ESO-1-derived peptide); red, positive controls (HLA-A*02:01-restricted peptides from flu and HIV viral antigens and Mart1/Melan-A melanoma-associated antigen); gray, experimental peptides containing the indicated mutation in comparison with the corresponding wild-type (wt) sequence. Data are mean ± SD of 2-3 replicates. P values are calculated with a two-sided unpaired t-test. b, Model illustrating the molecular basis of the T-cell stimulation assay and stimulation conditions (APC, antigen presenting cell; TCR, T-cell receptor). c, Representative plots of IFN-γ ± TNF-a expressing cells among CD8+CD3+ live T cells in PBMCs from patients with mutant p53 tumors as in Fig. 3a. d, Correlation analyses between indicated parameters in PBMC samples from R248Q mutant patients with presence of disease (N = 4) at the time of PBMC collection as in Fig. 3b. e, Estimate of mutant p53 amount per tumor cell before treatment in the same patients. Samples with R175H mutations are colored in blue. The sample which reacted, corresponding to the patient who received immune checkpoint blockade (ICB) therapy, is in solid blue, and the sample which did not react, and did not receive ICB, has filled-in lines. f, Flow cytometry gating strategy for total CD8 and non-naïve memory CD8 T-cells analyzed in Fig. 3c, d. TN: naïve T-cells, TCM: central memory T-cells, TEM, effector memory T-cells, TEMRA: effector memory T-cells re-expressing CD45RA.

