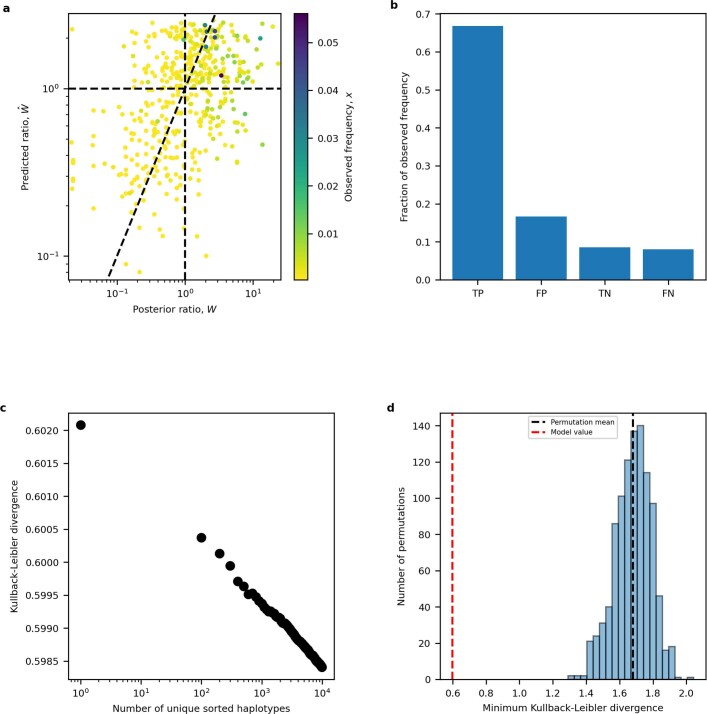
Extended Data Fig. 3. Fitness model prediction analysis.
a, Predicted ratio from combined fitness model plotted against posterior ratio for each TP53 mutation. Mutations are colored by their observed frequency. Ratios > 1 are predicted to be fixed in the cancer population. Diagonal line corresponds to ratios being equal. b, Prediction accuracy plotted as the proportion of observed mutation frequency for true positive (TP), false positive (FP), true negative (TN) and false negative (FN) model predictions. c, Kullback-Leiber divergence versus number of simulated HLA-I haplotypes shows improved model predictions according to the haplotype sample size. d, Internal validation by shuffling background mutation frequencies, functional phenotypes and immune phenotypes of TP53 mutations for 1,000 iterations and computing the Kullback-Leibler divergence for each iteration. The histogram is of the distribution of Kullback-Leibler divergences from all iterations. Permutation-mean Kullback-Leibler divergence is plotted as a vertical black dotted line and the true Kullback-Leibler divergence is plotted as a vertical red dotted line.

