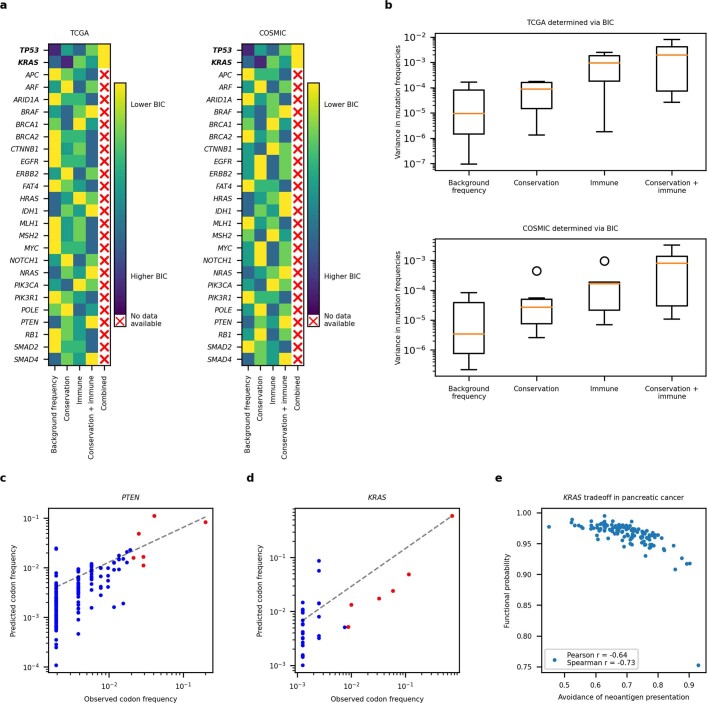
Extended Data Fig. 4. Fitness model predicts mutation frequencies in commonly mutated cancer driver genes.
a, Degree to which models of varying complexity account for mutation distributions from TCGA and COSMIC, excluding TCGA samples, across 27 commonly mutated cancer driver genes. Models are ranked by Bayesian Information Criterion (BIC) in descending order (models with the lowest BIC value are deemed the most explanatory). b, Boxplots of observed mutation frequency variances of driver genes best explained by a particular model, ranked by complexity in ascending order. c, Fitness model results for PTEN per protein position in TCGA, using both conservation and immunogenicity over background mutation rates. The full model is justified by the BIC value (KL divergence = 0.269; Pearson r = 0.701, p-value = 2.013e-24; Spearman r = 0.701, p-value = 2.386e-24). d, Fitness model results for KRAS per protein position in TCGA, using a full model with conservation, function and immunogenicity over background mutation rates with functional information available for seven frequent KRAS cancer mutations (G12A/C/D/R/V, G13D and Q61L). All components are justified by the BIC value (KL divergence = 0.256; Pearson r = 0.981, p-value = 2.095e-24; Spearman r = 0.616, p-value = 0.000104). e, Trade-off between gain-of-function and avoidance of neoantigen presentation, defined as , in TCGA pancreatic cancer for KRAS hotspots (Pearson −0.750, p-value = 2.599e-23; Spearman r = −0.774, p-value = 1.507e-25). Each point corresponds to an individual pancreatic cancer sample with a hotspot KRAS mutation.

