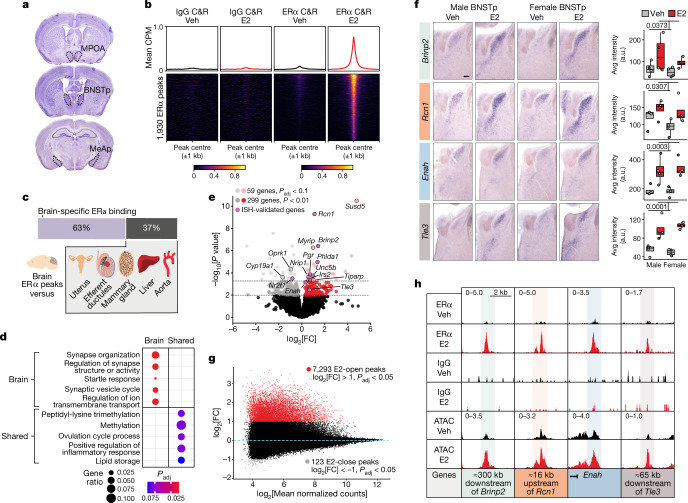
Fig. 1. Genomic targets of ERα in sexually dimorphic neuronal populations.
a, Coronal sections containing sexually dimorphic brain areas used for ERα CUT&RUN. MPOA, medial pre-optic area; BNSTp, posterior bed nucleus of the stria terminalis; MeAp, posterior medial amygdala. b, Line plots (top) and heatmaps (bottom) of mean IgG and ERα CUT&RUN (C&R) CPM ±1 kb around E2-induced ERα CUT&RUN peaks (DiffBind edgeR, Padj < 0.1). The heatmaps are sorted by E2 ERα CUT&RUN signal. Colour scale is counts per million (CPM). Veh, vehicle. c, Cross-tissue ERα comparison, showing the proportion of ERα peaks detected specifically in brain. d, Top Gene Ontology biological process terms associated with genes nearest to brain-specific or shared (≥4 other tissues) ERα CUT&RUN peaks (clusterProfiler, Padj < 0.1). e, Combined sex E2 versus vehicle RNA-seq in BNSTp Esr1+ cells; light grey and red dots (DESeq2, Padj < 0.1), dark grey and red dots (DESeq2, P < 0.01), purple dots (validated by in situ hybridization (ISH)). FC, fold change. Positive FC is E2-upregulated, negative FC is E2-downregulated. f, Images (left panels) and quantitative analysis (right panels) of ISH for select genes induced by E2 in both sexes. Boxplot centre, median; box boundaries, first and third quartiles; whiskers, 1.5 × IQR from boundaries. Two-way analysis of variance: Brinp2 P = 0.0373, Rcn1 P = 0.0307, Enah P = 0.0003, Tle3 P = 0.0001; n = 4 per condition; scale bar, 200 µm. g, MA plot of E2-regulated ATAC–seq peaks in BNSTp Esr1+ cells; red dots are E2-open peaks (DiffBind edgeR, log2[FC] > 1, Padj < 0.05), grey dots are E2-close peaks (DiffBind edgeR, log2[FC] < −1, Padj < 0.05). h, Example ERα peaks at E2-induced genes. Top left number is the y-axis range in CPM. Shaded band indicates peak region.

