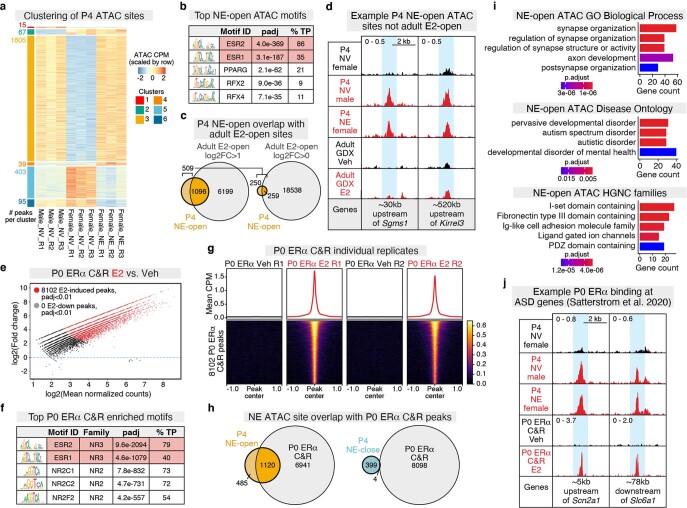
Extended Data Fig. 8. P4 ATAC-seq and P0 ERα CUT&RUN analysis.
a, Heatmap of mean ATAC CPM for P4 NV male, NV female, and NE female individual replicates (n = 3 per condition) at differential peaks (edgeR, glmQLFTest, padj < 0.1), grouped by hierarchical clustering (cutree, k = 6). Clusters c3 and c5 correspond to NE-open and NE-close sites, respectively, shown in Fig. 4a. b, Top enriched motifs (AME) in NE-open ATAC peaks. c, (left) Overlap between P4 NE-open ATAC peaks and adult E2-open ATAC peaks (log2FC > 1). (right) Overlap between remaining 509 P4 NE-open ATAC peaks and log2FC > 0 E2-open ATAC peaks. d, Example P4 NE-open ATAC peaks not detected as E2-induced in adult E2-open ATAC peakset. e, MA plot of P0 female E2 vs. female Veh ERα CUT&RUN peaks (DiffBind, DESeq2, padj < 0.01); red dots=E2-induced peaks, grey dots=E2-down peaks. f, Top enriched motifs (AME) in P0 E2-induced ERα peaks. g, Heatmap of mean P0 ERα CUT&RUN CPM ±1Kb around 8102 E2-induced ERα peaks for individual replicates (n = 2 per condition). h, (left) Overlap between P4 NE-open ATAC peaks and P0 E2-induced ERα peaks. (right) Overlap between P4 NE-close ATAC peaks and P0 E2-induced ERα peaks. i, (top) Top GO Biological Process terms (clusterProfiler, padj < 0.1), (middle) DO terms (clusterProfiler, padj < 0.1), and (bottom) HGNC gene families (clusterProfiler, padj < 0.1) enriched within P4 NE-open peak-associated genes. j, Example P0 ERα peaks overlapping P4 NE-open peaks at high-confidence ASD candidate genes, Scn2a1 and Slc6a1.

