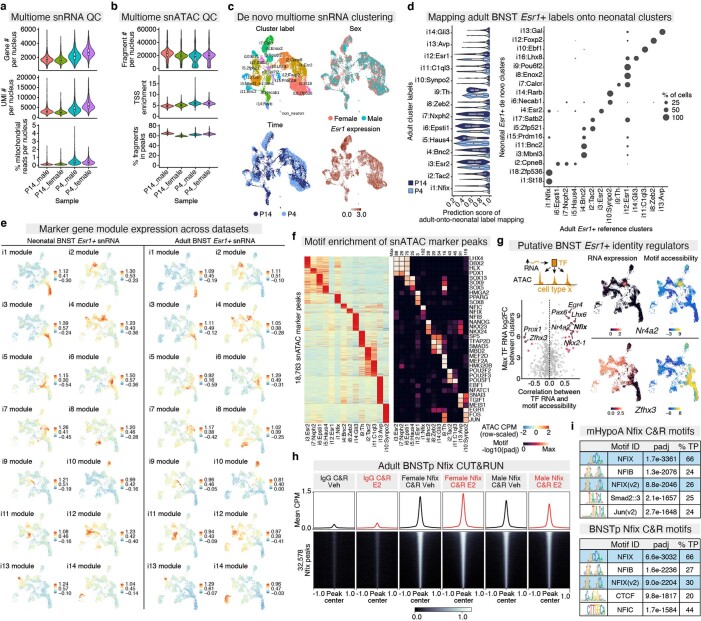
Extended Data Fig. 10. Additional analysis of neonatal BNST Esr1+ single-nucleus multiome dataset.
a–b, RNA (a) and ATAC (b) quality control (QC) metrics for neonatal (P4, P14) single-nucleus multiome experiments, split by timepoint and sex. Boxplot center=median, box boundaries=1st and 3rd quartile, whiskers=minimum and maximum values. n = 4265 P14_male, 3148 P14_female, 3128 P4_male, 4295 P4_female. c, UMAPs of de novo clustering of neonatal multiome snRNA data, colored by cluster identity (top left), sex (top right), timepoint (bottom left), and Esr1 expression (bottom right). d, (left) Prediction scores of adult-to-neonatal label transfer for each adult BNST Esr1+ reference cluster, split by timepoint. Boxplot center=median, box boundaries=1st and 3rd quartile, whiskers=minimum and maximum values. n = 14836 cells. (right) % of nuclei in each neonatal de novo cluster that mapped to each adult BNST Esr1+ cluster. e, UMAPs of neonatal marker gene module expression in neonatal dataset (left) and adult dataset (right). f, (left) Heatmap of pseudo-bulk ATAC CPM at 18783 marker peaks for neonatal multiome clusters. (right) Top three motifs enriched in marker peaks for each multiome cluster. g, (left) Correlation analysis of TF expression and motif accessibility across cells. Putative identity regulator TFs colored in pink. (right) TF RNA expression, activity score, and motif deviation UMAPs of example putative BNST Esr1+ neuron identity regulators, Nr4a2 and Zfhx3 (see also Fig. 3c, d). h, Heatmap of mean cortical IgG and BNSTp Nfix CUT&RUN CPM ±1Kb around 32,578 consensus Nfix peaks. i, Top motifs enriched (AME) in (top) 30,825 mHypoA cell Nfix CUT&RUN peaks (MACS2, q < 0.01) and in (bottom) 32,578 consensus BNSTp Nfix CUT&RUN peaks (MACS2, q < 0.01; peaks intersected across treatment and sex). %TP=% of peaks called as positive for the indicated motif.

