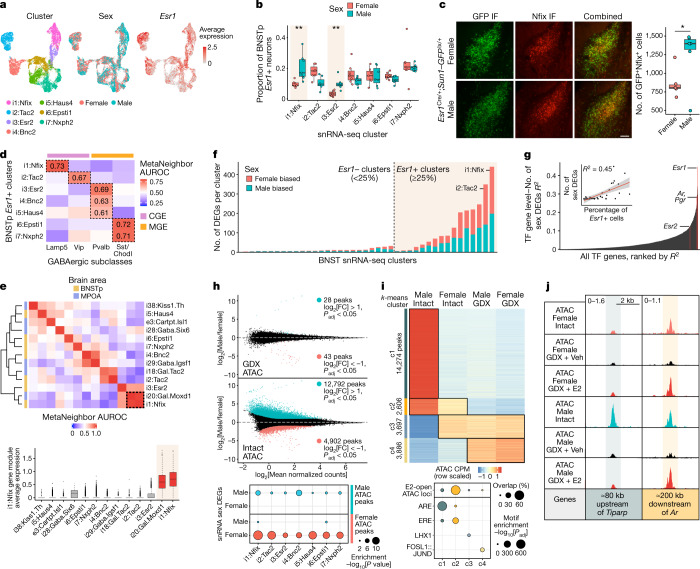
Fig. 2. Sex differences in cell type abundance and gene regulation in BNSTp Esr1+ cells.
a, Uniform manifold approximation and projection (UMAP) visualization of BNSTp Esr1+ snRNA-seq inhibitory neuron clusters, coloured by identity (left), sex (middle) and Esr1 expression (right). b, Proportion of BNSTp Esr1+ nuclei in each BNSTp Esr1+ inhibitory neuron cluster per sex. Higher proportions of i1:Nfix (Padj = 0.002) and i3:Esr2 (Padj = 0.002) neurons are in males than females. Boxplot centre, median; box boundaries, first and third quartiles; whiskers, 1.5 × IQR from boundaries, n = 7, **Padj < 0.01, one-sided, Wilcoxon rank-sum test, adjusted with the Benjamini–Hochberg procedure. c, BNSTp immunofluorescence (IF) staining for GFP (left micrographs) and Nfix (middle micrographs) in P14 female and male Esr1Cre/+;Sun1–GFPlx/+ animals (scale bar, 100 µm), with combined images (right micrographs) and their quantification (boxplots; right). Boxplot centre, median; box boundaries, first and third quartiles; whiskers, 1.5 × IQR from boundaries, n = 6, P = 0.0422, *P < 0.05, two-sided, unpaired t-test. d, Heatmap of median MetaNeighbor area under the receiver operating characteristic curve (AUROC) values for BNSTp Esr1+ clusters and cortical/hippocampal GABAergic neuron subclasses. The colour bar indicates the developmental origin of GABAergic subclasses. CGE, caudal ganglionic eminence; MGE, medial ganglionic eminence. e, Top: heatmap of MetaNeighbor AUROC values for BNSTp and MPOA Esr1+ clusters. Bottom: average expression of i1:Nfix marker genes across BNSTp and MPOA Esr1+ clusters. Dotted box indicates shared identity of i1:Nfix and i20:Gal.Moxd1 cells. n = 297 i20:Gal.Moxd1 cells, 2,459 i1:Nfix cells. Boxplot centre, median; box boundaries, first and third quartiles; whiskers, 1.5 × IQR from boundaries. f, Number of differentially expressed genes (DEGs) between females and males (DESeq2, Padj < 0.1) per BNST neuron snRNA-seq cluster. g, R2 between percentage of TF gene expression and number of sex DEGs per cluster across snRNA-seq clusters. The inset shows correlation for the top-ranked TF gene, Esr1. The error band represents the 95% confidence interval. h, Differential ATAC sites between gonadectomized (GDX), vehicle-treated females and males (top) and gonadally intact females and males (middle). Blue dots (edgeR, log2[FC] > 1, Padj < 0.05), red dots (edgeR, log2[FC] < −1, Padj < 0.05). Bottom: enrichment analysis of sex-biased ATAC peaks at sex DEGs. i, Top: k-means clustering (c1–c4) of differentially accessible ATAC peaks across four conditions(edgeR, Padj < 0.01). Bottom: dotplot showing the percentage of sites per cluster overlapping E2-open ATAC loci and motif enrichment analysis of peaks in each cluster (AME algorithm). ARE, androgen response element. j, Example ATAC peaks in k-means clusters 1 and 2. Top left number is the y-axis range in CPM. Shaded band indicates peak region.

