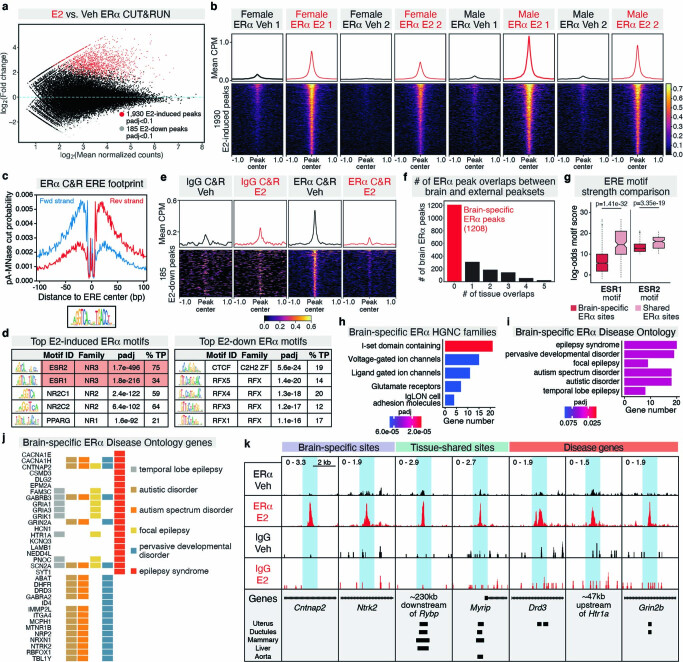
Extended Data Fig. 2. Additional analysis of adult brain ERα CUT&RUN dataset.
a, MA plot of differential ERα CUT&RUN peaks (DiffBind, edgeR, padj < 0.1) in adult mouse brain. red dots=E2-induced peaks, grey dots=E2-down peaks. b, Heatmap of mean brain ERα CUT&RUN CPM ±1Kb around 1930 E2-induced ERα CUT&RUN peaks (see also Fig. 1b) for individual replicates (n = 2 per condition). c, ESR1 motif footprint in ERα peaks (CUT&RUNTools). d, Top enriched motifs (AME) in (left) E2-induced ERα peaks and (right) E2-down ERα peaks. e, Heatmap of mean brain IgG and ERα CUT&RUN CPM ±1Kb around 185 E2-down ERα peaks. f, Number of overlaps between E2-induced ERα peaks and 7 external ERα ChIP-seq peaksets: intersected peaks of uterus 1 and uterus 2, intersected peaks of liver 1 and liver 2, aorta, efferent ductules, and mammary gland. Red indicates brain-specific ERα peaks. g, Log-odds motif scores (FIMO) for the ESR1 motif (MA0112.3, left) and ESR2 motif (MA0258.2, right) in brain-specific (red) and shared (pink) ERα peaks. Boxplot center=median, box boundaries=1st and 3rd quartile, whiskers=1.5*IQR from boundaries. n = 1304 brain-specific ESR1, 139 shared ESR1, 1276 brain-specific ESR2, 157 shared ESR2. p-values from two-sided, Wilcoxon rank-sum test. h, Top Hugo Gene Nomenclature Committee (HGNC) gene families (clusterProfiler, padj < 0.1) enriched within brain-specific ERα peak-associated genes. i, Top Disease Ontology terms associated with genes nearest to brain-specific ERα peaks (DOSE, padj < 0.1). j, Brain-specific ERα peak-associated genes within each enriched Disease Ontology (DO) term (clusterProfiler, padj < 0.1), colored by term k, Example brain-specific (Cntnap2, Ntrk2), shared (Rybp, Myrip), and disease-associated (Drd3, Htr1a, Grin2b) ERα peaks.

