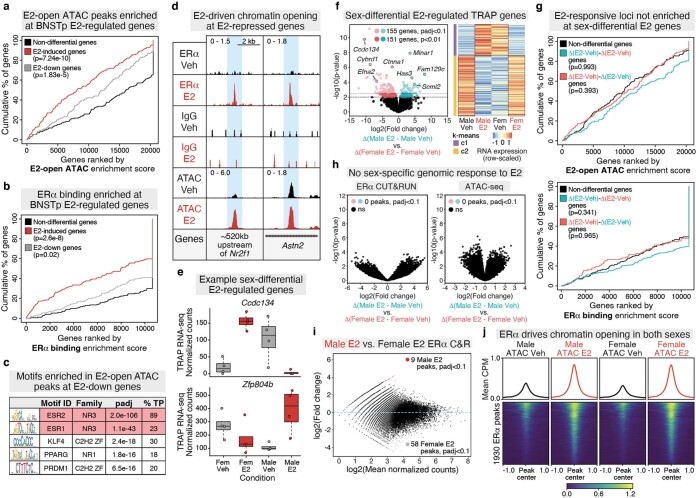
Extended Data Fig. 5. Integration of adult RNA-seq, ATAC-seq, and CUT&RUN datasets.
a–b, BETA enrichment of E2-open ATAC peaks (a) and brain ERα CUT&RUN peaks (b) at E2-induced and E2-down genes identified by RNA-seq (DESeq2, p < 0.01) relative to a background of non-differential, expressed genes. c, Top enriched motifs (AME) in E2-open ATAC peaks ±350Kb around E2-down genes (identified with BETA). d, Example E2-open ATAC peaks/ERα peaks at E2-repressed genes, Nr2f1 and Astn2. e, Normalized counts for example genes (Ccdc134, Zfp804b) with a sex-dependent response to E2 treatment. Boxplot center=median, box boundaries=1st and 3rd quartile, whiskers=1.5*IQR from boundaries. n = 4. f, (Left) Volcano plot of sex-dependent, E2-responsive genes; light blue and red dots (DESeq2, padj < 0.1), dark blue and red dots (DESeq2, padj < 0.1). (Right) Mean, normalized expression of sex-dependent, E2-responsive genes (DESeq2, padj < 0.1), grouped by k-means clustering. g, Lack of significant enrichment of E2-open ATAC peaks (top) and ERα peaks (bottom) at sex-dependent, E2-reponsive genes relative to a background of non-differential, expressed genes (BETA). h, Volcano plots of sex-dependent, E2-responsive ERα CUT&RUN peaks (edgeR, padj < 0.1) (left) and ATAC peaks (edgeR, padj < 0.1). i, MA plot of male E2 vs. female E2 ERα CUT&RUN peaks (DiffBind, edgeR, padj < 0.1); red dots=male E2-biased peaks, grey dots=female E2-biased peaks. j, Heatmap of mean ATAC CPM, split by sex and treatment, ±1Kb around E2-induced ERα peaks.

