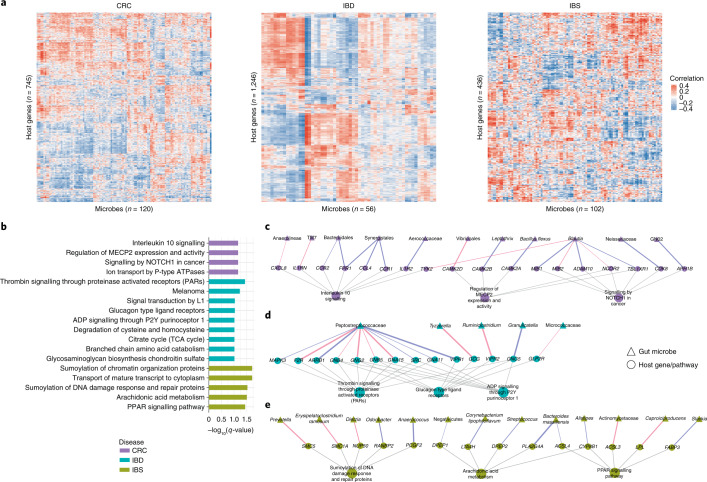
Fig. 3. Specific gut microbes are associated with individual host genes and pathways in each disease.
a, Heatmap showing the overall pattern of correlation between significant and stability-selected host genes (rows) and gut microbial taxa (columns) identified by the lasso model in CRC, IBD and IBS (FDR < 0.1). b, Host pathways enriched among genes that are correlated with specific gut microbes in CRC (purple), IBD (green) and IBS (yellow) (FDR < 0.1). c–e, Networks showing specific gut microbes correlated with specific host genes enriched for disease-specific host pathways in CRC (c), IBD (d) and IBS (e). Triangular nodes represent gut microbes, circular nodes represent host genes and pathways. Edge colour represents positive (blue) or negative (red) association, and edge width represents strength of association (Spearman rho). Grey edges represent host gene–pathway associations.

