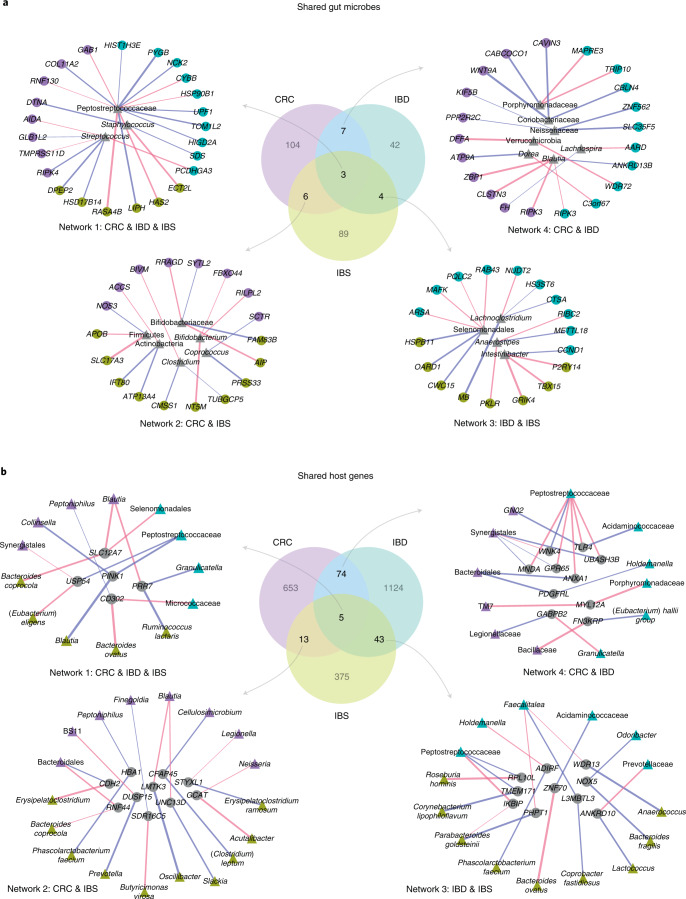
Fig. 4. Disease-specific gut microbe–host gene crosstalk.
a, Associations for ‘shared’ gut microbes, namely microbes that are associated with host genes in at least two diseases. Centre: Venn diagram showing overlap between gut microbes associated with host genes in CRC, IBD and IBS. Counter-clockwise, left to right: networks showing host gene–microbe associations for gut microbes shared across associations in CRC, IBD and IBS (Network 1), CRC and IBS (Network 2), IBD and IBS (Network 3), and CRC and IBD (Network 4). b, Associations for ‘shared’ host genes, that is, genes that are associated with microbes in at least two diseases. Centre: Venn diagram showing overlap between host genes associated with gut microbes in CRC, IBD and IBS. Counter-clockwise, left to right: networks showing host gene–microbe associations for host genes shared across associations in CRC, IBD and IBS (Network 1), CRC and IBS (Network 2), IBD and IBS (Network 3), and CRC and IBD (Network 4). Circular nodes represent host genes, triangular nodes represent gut microbes. Coloured nodes represent specific diseases (purple, CRC; green, IBD; yellow, IBS), grey nodes represent gut microbes (a) and host genes (b) shared between associations across diseases. Edge colour represents positive (blue) or negative (red) association, and edge width represents strength of association (Spearman rho). All associations were determined at FDR < 0.1.

