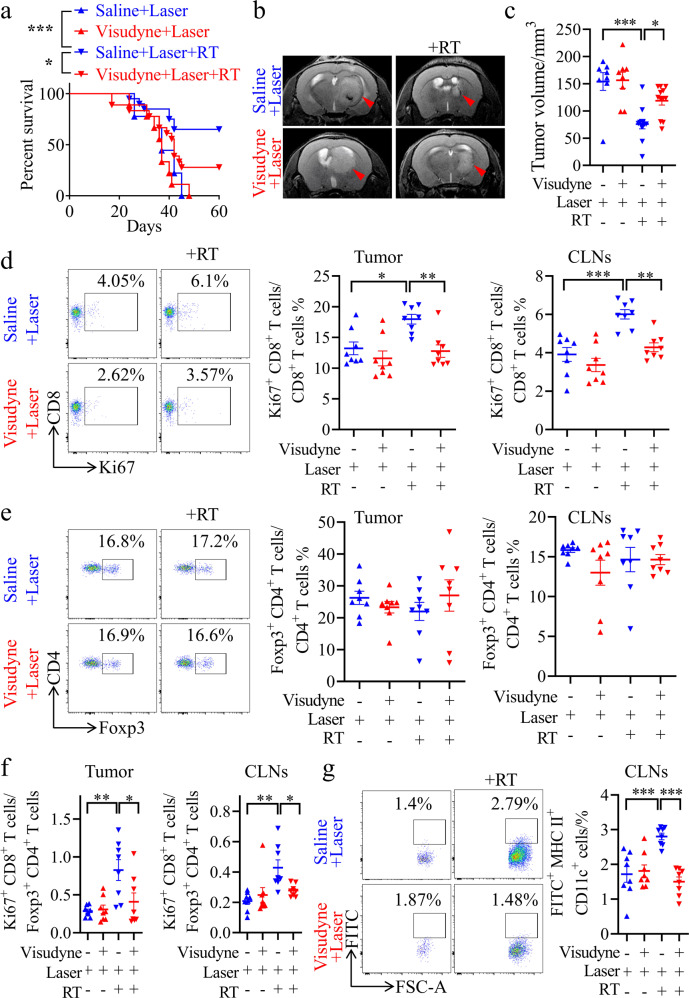
Fig. 2. MLV ablation weakens the therapeutic effect of RT.
a Survival of mice with striatal GL261 tumor injection with or without RT, saline plus laser treatment (Saline + Laser, n = 9; Saline + Laser + RT, n = 20), or Visudyne plus laser treatment (Visudyne + Laser, n = 8; Visudyne + Laser + RT, n = 18). b Representative T2-weighted single brain slices from the above groups (triangles indicate tumors). c Tumor volume quantified from MRI images of the above groups on day 22 after inoculation (Saline + Laser, n = 8; Saline + Laser + RT, n = 12; Visudyne + Laser, n = 8; Visudyne + Laser + RT, n = 12). d, e Representative flow cytometry plots of CD8+ Ki67+ T cells as percentages of the total CD8+ T cells (d), and CD4+ Foxp3+ T cells as percentages of the total CD4+ T cells (e) in CLNs (left) and quantification (right) in tumors and CLNs from the above groups on day 22 after inoculation (n = 8). f Ratios of CD8+ Ki67+ T cells to CD4+ Foxp3+ T cells in tumors and CLNs from the above groups (n = 8). g Left panel, representative flow cytometry dot plots of DC trafficking from GL261 tumors to CLNs shown by the quantity of CD11c+ MHCII+ FITC+ cells (FITC+ DCs) in the CLNs 24 h after intratumoral injection of FITC-labeled latex beads. Right panel, quantification of FITC+ DCs as a fraction of all MHC II+ CD11c+ cells in CLNs (n = 8). Data are presented as means ± SEM. *P < 0.05, **P < 0.01, ***P < 0.001; log-rank (Mantel–Cox) test (a); one-way ANOVA (c–g). Data are from at least three (a, d–g) or two (b, c) independent experiments.

