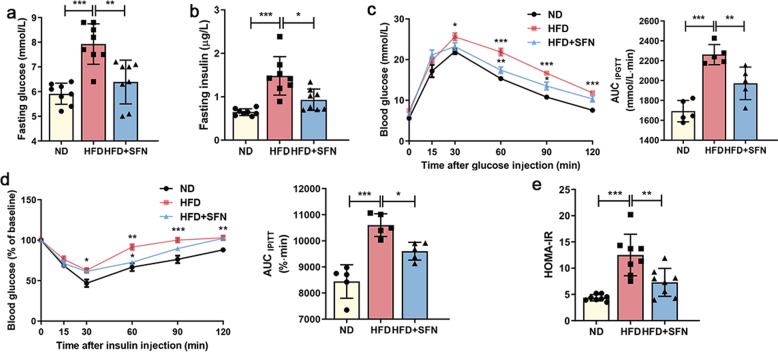
Fig. 3. Effects of SFN on glucose tolerance and insulin sensitivity.
Levels of (a) blood glucose and (b) plasma insulin in mice after fasting for 12 h (n = 8). c Glucose tolerance tests (GTTs, 2 g/kg) and the calculation of corresponding area under the curve (AUC) (n = 5). d Insulin tolerance tests (ITTs, 0.75 U/kg), presented as % of baseline glucose to control for differences in baseline glucose, and the AUC calculations (n = 5). e HOMA-IR was calculated based on (a) fasting glucose and (b) insulin levels (n = 8). Data are mean ± SD. *P < 0.05, **P < 0.01, ***P < 0.001.

