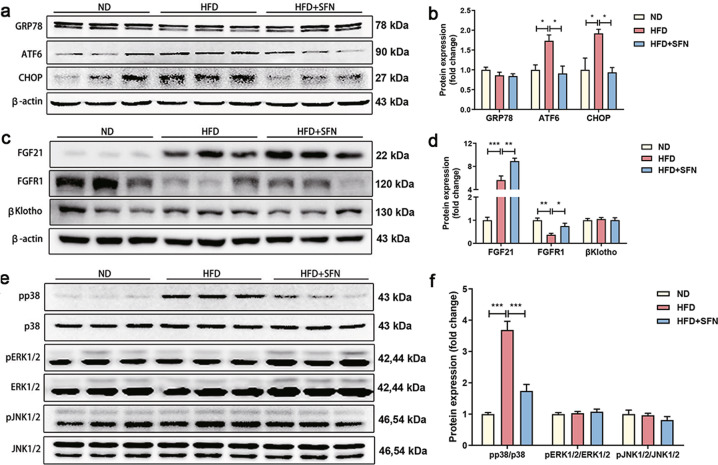
Fig. 4. Regulation of hepatic ER stress, FGF21-related and MAPK protein expression levels by SFN.
a, b Representative blots of ER stress-related proteins and the densitometric analysis. c, d Representative blots of FGF21-related proteins and the densitometric analysis. e, f Representative blots of MAPK-related proteins and the densitometric analysis. n = 6. Data are mean ± SD. *P < 0.05, **P < 0.01, ***P < 0.001.

