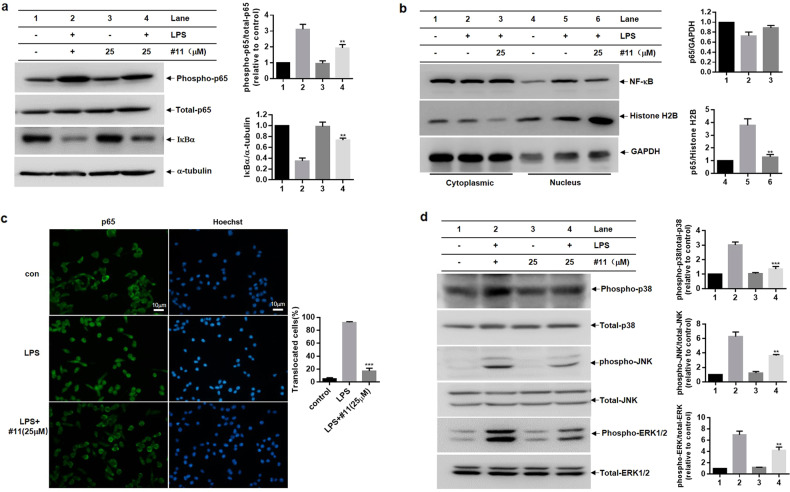
Fig. 9. Compound 11 inhibits LPS-induced BV-2 microglial cells activation via NF-κB and MAPK signaling.
BV-2 microglial cells were primed with compound 11 (25 μM) for 30 min before LPS stimulation. a Western blot analysis of phospho-p65, p65, IκBα, and α-tubulin protein levels in LPS-primed BV-2 microglial cells at 20 min (a, left). The relative expression of phospho-p65 and IκBα was quantified by densitometric analysis (a, right). b Western blot analysis of p65 and Histone H2B in the nuclear fraction and Western blot analysis of p65 and GAPDH in the cytoplasm of LPS-primed BV-2 microglial cells at 1 h (b, left). Histone H2B and GAPDH were used as internal controls. The relative expression of p65 in the nucleus and cytoplasm was quantified by densitometric analysis (b, right). c After 1 h of LPS stimulation, NF-κB p65 subunit localization was visualized by immunofluorescence analysis, and all cell nuclei were counterstained with Hoechst. The scale bar represents 10 μm (c, left). The ratio of cells with p65 nuclear translocation was calculated by counting at least 100 cells in a coverslip (c, right). d Western blot analysis of MAPKs (p38, JNK, ERK) in the lysates of LPS-primed BV-2 microglial cells at 1 h (d, left). Total p38, JNK, and ERK were used as internal controls, and the relative phosphorylation level of p38, JNK, and ERK was quantified by densitometric analysis (d, right). **P < 0.01, ***P < 0.001 compared with the LPS-alone group.

