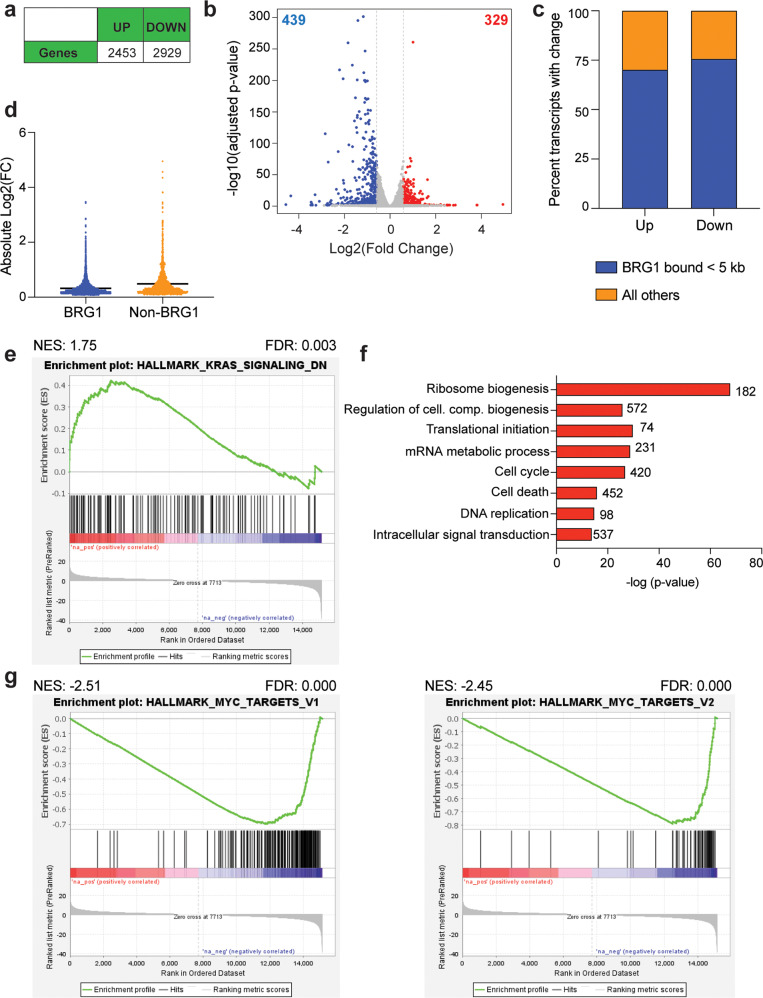
Fig. 2. ACBI1 treatment causes diverse gene expression changes predominantly at BRG1-bound genes.
a Total number of differentially expressed genes that were increased in expression (“up”) or decreased (“down”) in response to 24 h ACBI1 treatment. FDR < 0.05 was used for determining significantly changed genes. b Volcano plot showing all gene expression changes in each direction. Red represents genes that were increased in expression with a fold change > 1.5 and blue represents genes that were decreased in expression with a fold change < −1.5. c Transcripts with a change in each direction were compared to publicly available BRG1 ChIP-seq data (GSE90634, [4, 15]). Regardless of direction, most transcripts that significantly change show BRG1 binding within 5 kb of the transcription start site. d Scatter dot plot showing the absolute value of all individual log2FC changes for genes bound by BRG1 versus non-bound as defined in c. Line falls at mean of each sample. e Gene set enrichment analysis (GSEA) for all gene expression changes compared against MSigDB hallmark datasets. Transcripts changed following ACBI1 treatment show positive enrichment within ranked list of genes in the “KRAS signaling down” hallmark dataset. f Gene ontology (GO) analysis of transcripts that are decreased by ACBI1 treatment. Number of genes in each term are shown next to the bar, cell. com. = cellular component. g GSEA analysis showing the two most significant MSigDB hallmark lists that resulted from comparing all gene expression changes with ACBI1 treatment against the MSigDB hallmark datasets. Transcripts that are changed following ACBI1 treatment show a negative enrichment within a ranked list of MYC targets, V1 and V2.

