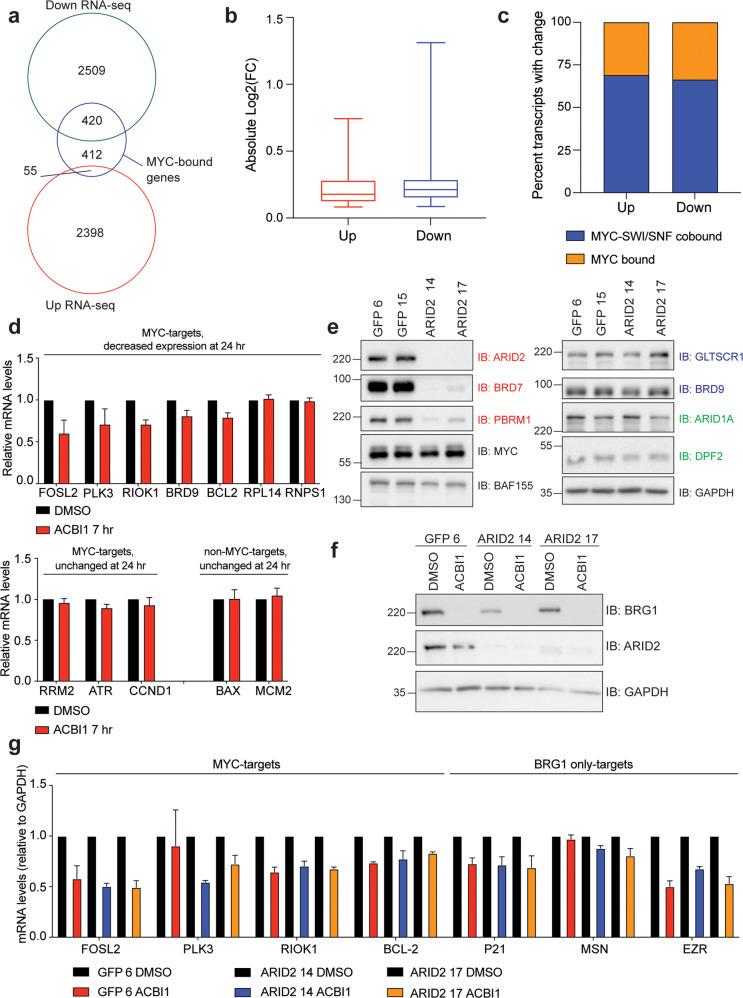
Fig. 3. Loss of BRG1 impacts MYC target gene expression.
a Venn diagram comparing transcript changes (Fig. 2a) to MYC-bound genes as determined by ChIP-seq [7]. b Box-and-whisker plot showing the absolute log2FC change for the 420 MYC-bound genes with decreased expression or the 55 MYC-bound genes with increased expression identified in a. Plot shows the 25th to 75th percentile, middle line marks the median with whiskers extending from minimum to maximum point. c Stacked bar graph showing the percentage of all MYC-bound genes with a transcript change in a that are also bound by BRG1 and BAF155 (“SWI/SNF”, [15]). d mRNA analysis of indicated genes following treatment of G401 cells for 7 h with ACBI1 or DMSO control as determined by RT-QPCR analysis. GAPDH is used as a reference gene for normalization (n = 3 biological replicates, error bars are standard error). e ARID2 was removed in G401 cells using CRISPR/Cas9 technology and clones validated for removal of ARID2 by western blot. ARID2 clone 14 and 17 are compared to two control clonal lines in which CRISPR was performed using a guide targeting the green fluorescent protein (GFP) gene. ARID2 loss causes specific reduction in pBAF complex subunit members PBRM1 and BRD7. GAPDH is used as a loading control. Red text denote pBAF-specific subunits, blue text are ncBAF specific subunits, and green text is cBAF specific subunits. f Indicated cell lines were treated for 24 h with 250 nM ACBI1 or DMSO control and protein lysates probed for BRG1 depletion. g mRNA analysis of MYC- or BRG1-only targets following treatment of indicated cell lines for 24 h with ACBI1 or DMSO control as determined by RT-QPCR analysis. GAPDH is used as a reference gene for normalization (n = 3 biological replicates, error bars are standard error).

