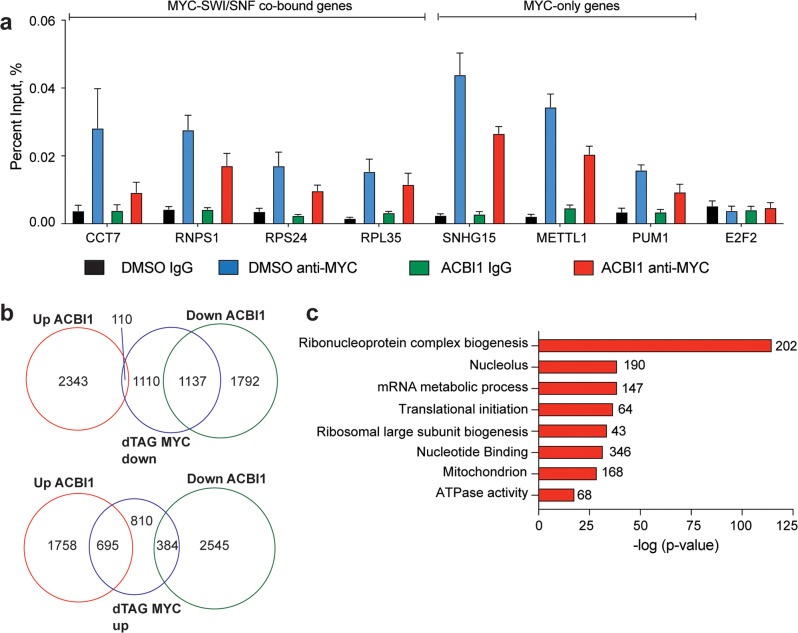
Fig. 4. Removal of BRG1 compared to removal of MYC.
a Chromatin immunoprecipitation followed by QPCR for various MYC-bound loci after ACBI1 treatment for 24 h. E2F2 serves as a negative control for binding (n = 4 biological replicates, error bars are standard error). b Venn diagram comparing all significant transcript changes that result from ACBI1 treatment to decreased (top) or increased (bottom) gene expression changes that occur after removal of MYC using the dTAG approach [15]. c GO analysis of 1137 genes that are commonly decreased in expression across dTAG MYC and ACBI1 samples. Number of genes in each term are shown next to the bar.

