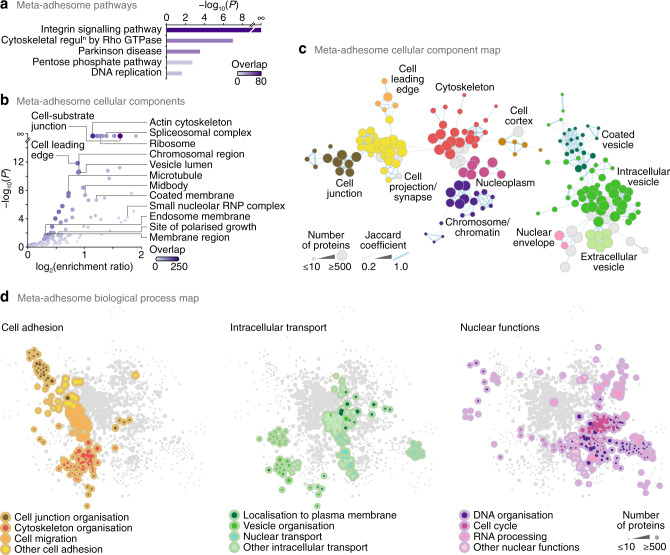
Fig. 1. Nucleus-associated adhesome proteins.
a, b Over-representation analyses of PANTHER pathways (a) and Gene Ontology cellular components (b) in the meta-adhesome. Representative labelled terms were determined using affinity propagation, except for the terms cell-substrate junction and cell leading edge. Purple shading intensity indicates size of meta-adhesome protein overlap with respective gene sets. For a, terms with enrichment ratio (observed genes/expected genes in gene set) > 2 are displayed (P < 0.025, one-sided hypergeometric test with Benjamini–Hochberg correction). RNP, ribonucleoprotein. c Graph-based clustering of over-represented cellular components in the meta-adhesome. A force-directed graph was generated from gene-set membership of enriched Gene Ontology terms (P < 0.01, one-sided hypergeometric test with Benjamini–Hochberg correction). Representative cellular components summarising selected clusters of enriched terms are labelled. Node (circle) size represents the number of meta-adhesome proteins annotated for each enriched term; node fill colour represents cellular component annotation. Edge (line) weight is proportional to the overlap of gene-set membership of connected nodes (Jaccard coefficient ≥ 0.2). The two largest connected components are shown (see also Supplementary Fig. 1b). d Graph-based clustering of over-represented biological processes in the meta-adhesome. Enriched Gene Ontology terms associated with cell adhesion (left panel), intracellular transport (middle panel) and nuclear functions (right panel) are coloured as indicated. The largest connected component is shown, and edges were omitted for clarity (see Supplementary Fig. 1a).

