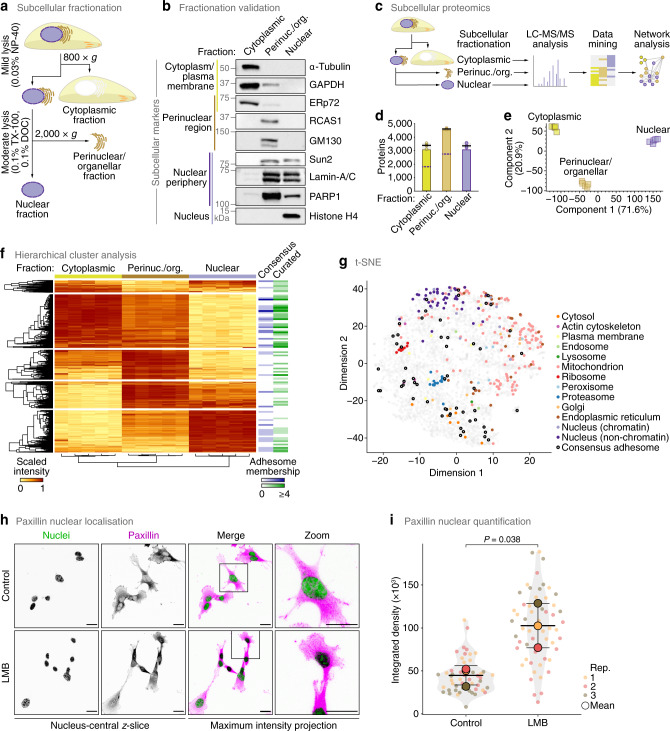
Fig. 2. Characterisation of a nucleo-adhesome.
a Methodological workflow for subcellular fractionation and enrichment of nuclei. DOC, sodium deoxycholate; TX-100, Triton X-100. b Effective subcellular fractionation of SCC cells. Markers for given subcellular locations are indicated. Immunoblots are representative of five independent experiments. c Workflow for mass spectrometric characterisation of cytoplasmic, perinuclear and nuclear subproteomes of SCC cells. d Numbers of proteins identified in each subcellular fraction. Black bar, median; light grey box, range; circle, replicate data point (n = 5 independent biological replicates). Numbers of proteins identified in at least four out of five biological replicate subcellular fractions are represented as bars. Purple dashed lines indicate numbers of proteins also identified in nuclear fractions (regardless of relative abundance). e Principal component analysis of proteins quantified in at least four out of five biological replicate experiments. f Hierarchical cluster analysis of the cytoplasmic, perinuclear and nuclear subproteomes. Relative protein abundance was min-max scaled protein-wise (scaled intensity). Memberships of the consensus adhesome and literature-curated adhesome are indicated (bins, 50 proteins). g t-SNE map of the subcellular proteomes (Supplementary Data 2) annotated with curated subcellular markers and consensus adhesome proteins. h Confocal imaging of SCC cells in the presence or absence of 10 nM leptomycin B (LMB). Nuclei were detected using NucBlue. z-slices passing through the centres of the nuclei (greyscale channels) are shown alongside maximum intensity projections (merged channels). Inverted lookup tables were applied; in merged images, colocalisation of paxillin (magenta) and NucBlue (green) is represented by black regions. Images are representative of three independent experiments. Scale bars, 20 μm. i Quantification of nuclear paxillin signal in nucleus-central z-slices (see h). Black bars, condition mean (thick bar) ± s.d. (thin bars); grey silhouette, probability density. Data from different biological replicates (rep.) are indicated by coloured circles; replicate means are indicated by large circles. Statistical analysis, two-sided Welch’s t-test of replicate means (n = 52 and 57 cells for control and LMB treatment, respectively, from n = 3 independent biological replicates). Source data are provided as a Source Data file.

