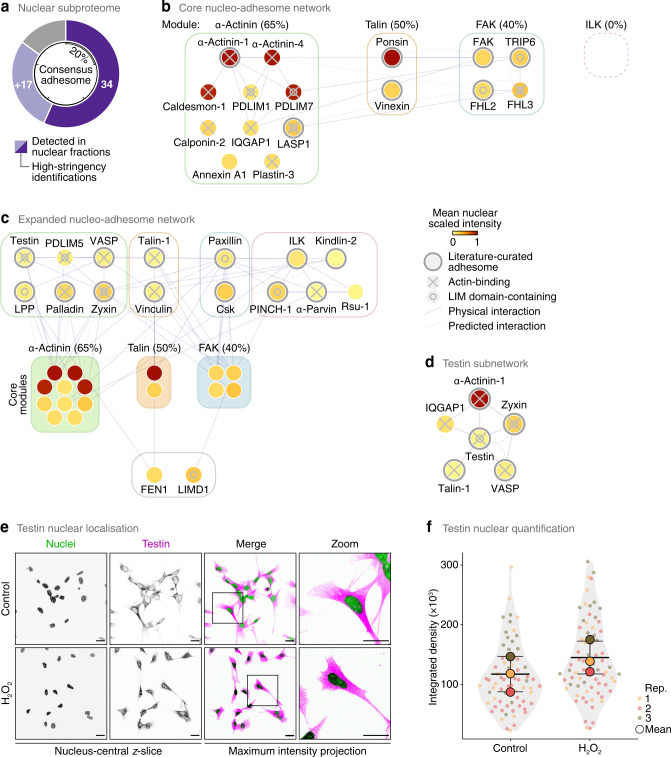
Fig. 3. Network analysis identifies testin as a nucleo-adhesome-associated protein.
a Proportion of the consensus adhesome quantified in SCC cell nuclear fractions. High-stringency proteins (dark purple segments) were identified in all five biological replicate experiments and quantified with a > 5% fraction of the cellular pool; light purple segments indicate additional proteins detected in nuclear fractions. Tick marks indicate 20% increments. b Curated interaction network model of high-stringency nuclear proteins present in the four putative signalling axes (modules) of the consensus adhesome. Coverage of each module is indicated in parentheses. c Curated core nucleo-adhesome network (see b) expanded to include additional consensus adhesome proteins detected In nuclear fractions. d Direct interaction neighbourhood of testin in the expanded nucleo-adhesome network (see c). For b–d, node (circle) fill colour represents the mean scaled intensity of nuclear fraction replicates; thick grey node borders indicate representation in the literature-curated adhesome. Edges (lines) represent reported interactions. e Confocal imaging of SCC cells in the presence or absence of hydrogen peroxide (H2O2). Nuclei were detected using NucBlue. z-slices passing through the centres of the nuclei (greyscale channels) are shown alongside maximum intensity projections (merged channels). Inverted lookup tables were applied; in merged images, colocalisation of testin (magenta) and NucBlue (green) is represented by black regions. Images are representative of three independent experiments. Scale bars, 20 μm. f Quantification of nuclear testin signal in nucleus-central z-slices (see e). Black bars, condition mean (thick bar) ± s.d. (thin bars); grey silhouette, probability density. Data from different independent biological replicates (rep.) are indicated by coloured circles; replicate means are indicated by large circles. P > 0.05; statistical analysis, two-sided Welch’s t-test of replicate means (n = 67 and 72 cells for control and H2O2 treatment, respectively, from n = 3 independent biological replicates). Source data are provided as a Source Data file.

