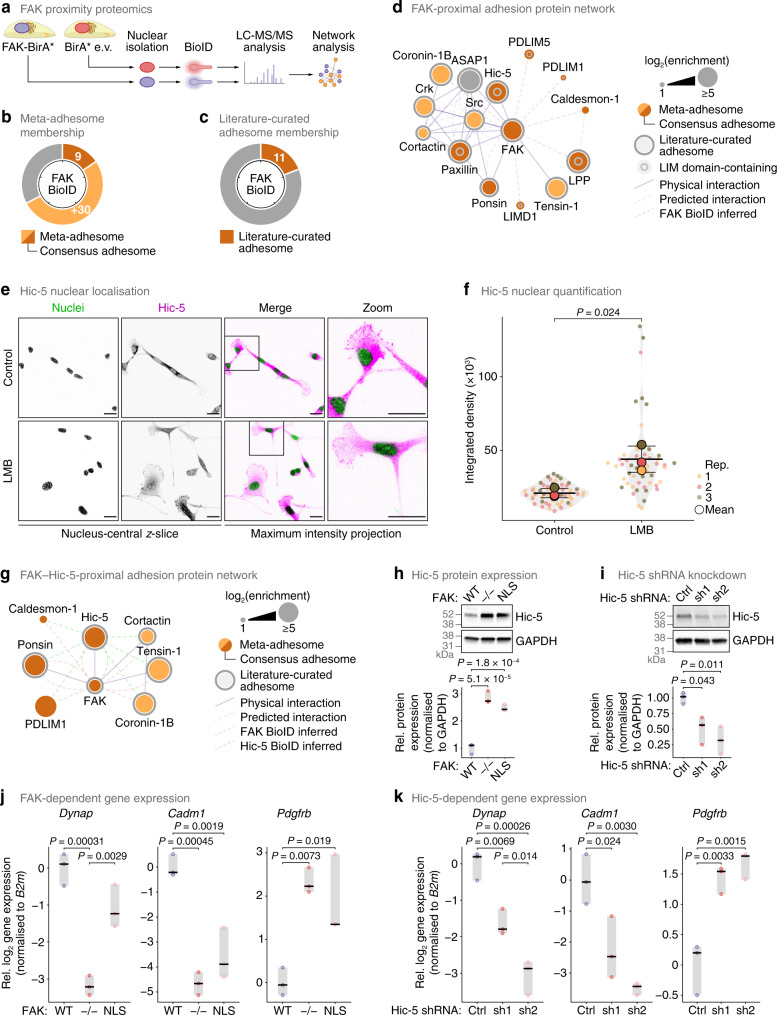
Fig. 5. Analysis of the FAK-proximal nuclear subproteome identifies nuclear interaction with Hic-5.
a Workflow for mass spectrometric characterisation of FAK-proximal nuclear proteins. b, c Proportions of specific FAK-proximal proteins (P < 0.05, one-sided Student’s t-test with FDR correction) quantified in the meta-adhesome, including the consensus adhesome (b), and the literature-curated adhesome (c). Tick marks indicate 20% increments. d Interaction network analysis of FAK-proximal nuclear proteins present in the consensus or literature-curated adhesomes, clustered according to connectivity (reported interactions or proximal associations inferred from BioID data; edges). e Confocal imaging of SCC cells in the presence or absence of 10 nM LMB, as for Fig. 2h, except magenta is Hic-5. Images are representative of three independent experiments. Scale bars, 20 μm. f Quantification of nuclear Hic-5 signal in nucleus-central z-slices (see e). Black bars, condition mean (thick bar) ± s.d. (thin bars); grey silhouette, probability density. Data from different independent biological replicates (rep.) are indicated by coloured circles; replicate means are indicated by large circles. Statistical analysis, two-sided Welch’s t-test of replicate means (n = 54 and 52 cells for control and LMB treatment, respectively, from n = 3 independent biological replicates). g Interaction network analysis of the intersection of specific FAK- and Hic-5-proximal nuclear proteins present in the consensus or literature-curated adhesomes, clustered as for d. h Total cell lysates from SCC cells (top) and quantification of Hic-5 protein expression (bottom). Protein expression was normalised to GAPDH and expressed relative to SCC FAK-WT. i Total cell lysates from SCC FAK-WT cells transfected with two independent Hic-5 shRNAs (sh1, sh2) or empty-vector control (Ctrl) (top) and quantification of Hic-5 protein expression (bottom, as for h). j, k RT-qPCR analyses of expression of selected genes identified by nuclear multi-omic analysis (see Fig. 4) in SCC cells (j) and cells depleted of Hic-5 (k). Gene expression was normalised to B2m, binary-logarithm transformed and expressed relative to FAK-WT (j) or Ctrl (k) cells. For h–k, black bar, median; light grey box, range. Statistical analysis, one-way ANOVA with Tukey’s correction (n = 3 independent biological replicates). Source data are provided as a Source Data file.

