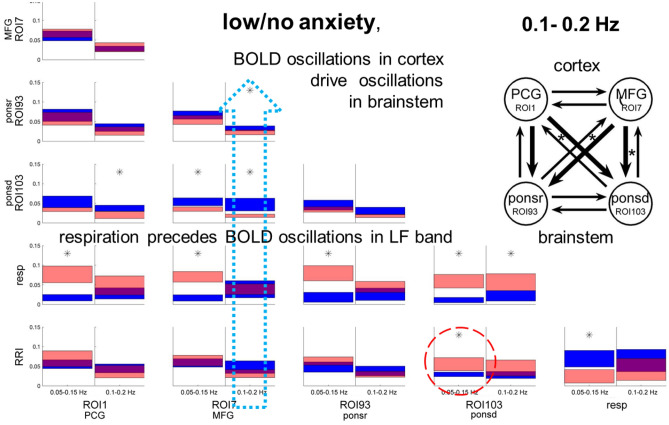
Figure 2.
Directed coupling strengths for the low/no (LA) anxiety group in the IMF band (right columns) and the LF band (left columns). Each box shows the strength of coupling as a position on the vertical axis. The width of bars is proportional to the mean error (errors were based on percentiles of distribution). The blue color shows the flow from the signal marked below the given column to the signal marked on the left, and the red color the flow from the signal marked on the left to the signal marked below. Significant differences between couplings of in- and outflow are marked by stars (p < 0.05). Note the significant information flows from the MFG (ROI 7) to the pons (ROI 93,103), RRI and respiration, which is indicated by a stippled blue arrow. In addition, there is a significant information flow from RRI signals to the brainstem in the LF band (marked by a stippled circle). The upper insert shows the directed coupling strengths between BOLD signals only, encoded by the thickness of the arrows. Each arrow indicates the direction and the strength of information flow, stars mark significant changes (p < 0.05).

