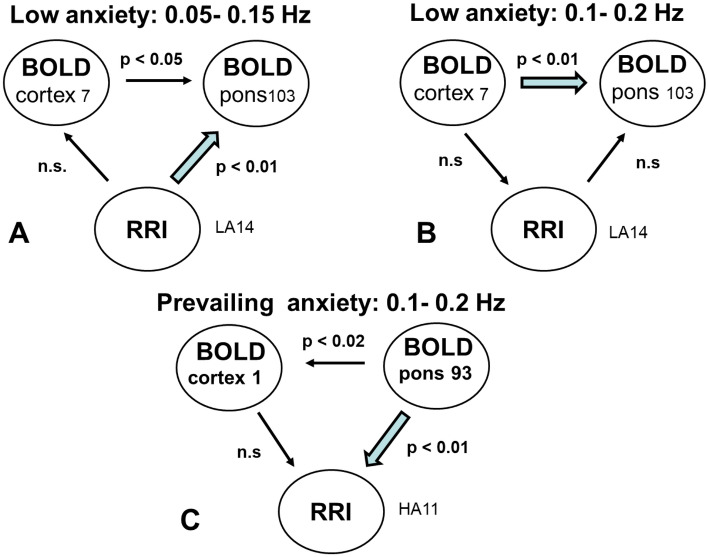
Figure 4.
Diagrams for directed coupling between slow BOLD oscillations (in the cortex and the brainstem) and RRI signals. (A) Significant information flow during low/no anxiety from cortex and RRI to the brainstem in the LF band. (B) Significant information flow during low/no anxiety from cortex to the brainstem in the IMF band. (C) Dominant information flow during prevailing anxiety from brainstem to RRI and into cortex in the IMF band. Blue arrows indicate the most important information flows.

