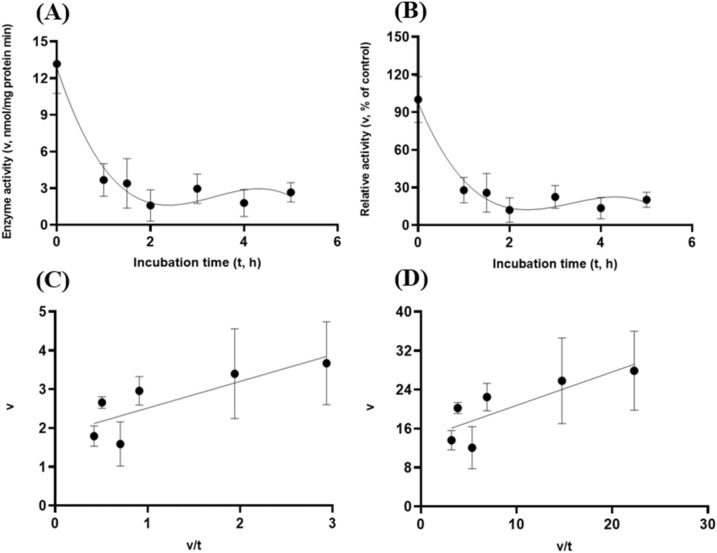
Figure 12.
Experiment-3 of the intestinal pancreatic trypsin (78 U/mL) effects (with describing model parameter estimates on GH5-tCel5A1 activity over a 5-h period after the intestinal pancreatic trypsin buffer being mixed with the GH5-tCel5A1enzyme preparation for incubation at the resulting mixture pH = 6.0–7.0 and trypsin (78 U/mL) prior to further incubation for measuring cellulase activity with the carboxymethyl cellulose (CMC) substrate buffer in presence of dithiothreitol (DTT) (5 mM) and N2 gas purging for 15 min at 37 °C. (A) Plot of the inhibition kinetic relationship between the GH5-tCel5A1 activity (v, mean nmol/mg protein•min) and incubation time (t, h) under the trypsin (78 U/mL) condition established according to the cubic response model as: , P < 0.0001 for the intercept; P = 0.0001 for the linear parameter; P = 0.006 for the quadratic parameter estimate; and P = 0.035 for the cubic parameter, , n = 84; and alternatively, according to the linear regression model as: , P < 0.0001 for the intercept; and P = 0.001 for the slope, , n = 84; (B) Plot of the inhibition kinetic relationship between the relative GH5-tCel5A1 activity (v, mean % of the control group measured at Ic of 100.000 ± 18.294 at 0-min exposure to the trypsin-78-U/mL incubation) and incubation time (t, h) established according to the cubic response model: , P < 0.0001 for the intercept; P = 0.0001 for the linear parameter estimate; P = 0.006 for the quadratic parameter estimate; and P = 0.035 for the cubic parameter estimate, , n = 84; and alternatively, according to the linear regression model established as: , P < 0.0001 for the intercept; and P = 0.001 for the slope; , n = 84; (C) the Eadie-Hofstee linear plot between the GH5-tCel5A1 enzyme activity (v, mean nmol/mg protein•min) and the v/t ratio established as: , P = 0.008 for the intercept; and P < 0.0001 for the slope, , n = 72; and (D) the Eadie-Hofstee linear plot between the relative GH5-tCel5A1 enzyme activity (v, mean % of the control group measured at Ic of 100.000 ± 18.294) at 0-min exposure to the trypsin-78-U/mL incubation) incubation] and the v/t ratio established as , P = 0.008 for the intercept; and P < 0.0001 for the slope; , n = 72.

