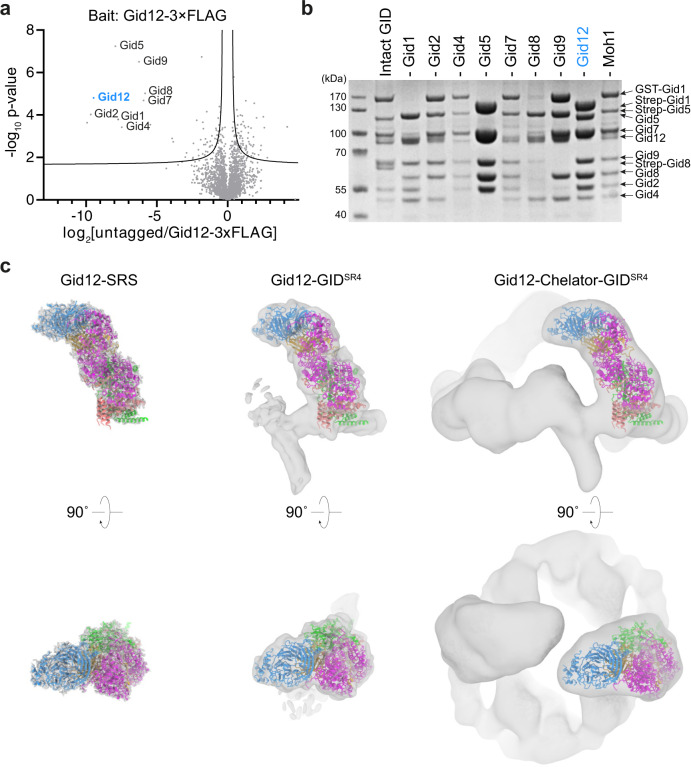
Fig. 1. Gid12 binds to the Gid4-containing GID E3 ligase complexes.
a Quantitative MS identification of proteins interacting with Ipf1-3×FLAG (originally YDL176W, now called Gid12) or an untagged control strain under glycolytic conditions (n = 3 biologically independent samples). Data are log-transformed ratios of protein LFQ intensities versus −log10-transformed P values of two-tailed Student’s t tests. The hyperbolic curve separates specifically interacting proteins from background (square; false-discovery-rate-adjusted P = 0.05; minimal fold change S0 = 0.1). The bait protein Gid12 is highlighted in blue. b SDS-PAGE of GST- or Strep-affinity purifications after co-infecting insect cells with all GID E3 ligase subunits except the one indicated above the lane. Lane 1 shows the result from a control co-infection with all subunits (n = 3 biologically independent experiments). c Coordinates of Gid12 bound to the substrate-receptor and scaffolding module (Gid12-SRS) were docked into the cryo-EM density maps of Gid12-SRS, Gid12 bound to GIDSR4 (Gid12-GIDSR4) and Chelator-GIDSR4 (Gid12-Chelator-GIDSR4) at 3.3, 9.8, and 19.4 Å resolution, respectively, from left to right. Gid12 is colored in blue, Gid4 in gold, Gid5 in magenta, Gid8 in salmon, and Gid1 in green.

